E-mini S&P 500 Index (ES) Futures Technical Analysis – Needs to Hold 4786.00 to Sustain Upside Momentum
March E-mini S&P 500 Index futures are trading higher shortly after the cash market opening on Tuesday. The benchmark index hit another record high as worries about the Omicron variant of the coronavirus subsided and travel stocks bounced, while shares of Ford gained on an upbeat electric pickup production forecast.
At 14:50 GMT, March E-mini S&P 500 Index futures are trading 4802.25, up 16.25 or +0.34%. The S&P 500 Trust ETF (SPY) is at $479.35, up $1.64 or +0.34%.
Travel stocks led premarket advances with a 2.1% rise in Carnival Corp leading gains among cruise operators, while American Airlines gained 1.5%.
Value-oriented bank stocks including Bank of America, Goldman Sachs, JPMorgan Chase & Co and Citigroup also rose about 1% each.
Big technology stocks that led gains in the previous session also rose, with Apple Inc, Tesla Inc, Meta Platforms Inc, Netflix Inc and Amazon.com Inc gaining between 0.1% and 0.5%.

Daily Swing Chart Technical Analysis
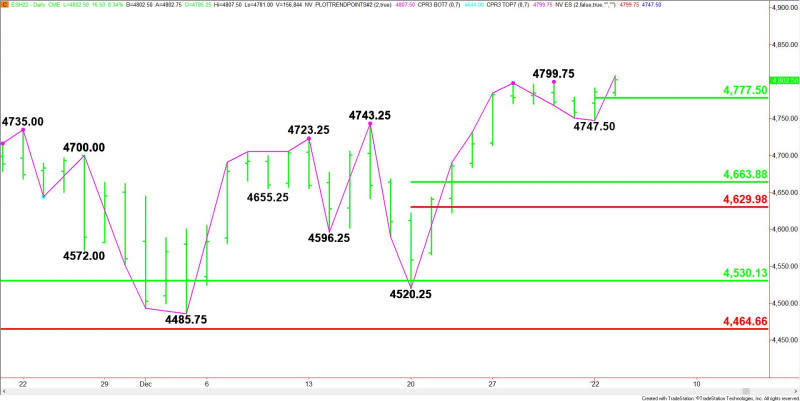
The main trend is up according to the daily swing chart. A trade through $4747.50 will change the main trend to down.
The minor range is 4747.50 to 4808.25. Its pivot at 4777.50 is the nearest support. This level will move up as the market moves higher.
The short-term range is 4520.25 to 4808.25. If the main trend changes to down then its retracement zone at 4663.75 to 4630.00 will become the primary downside target.
Daily Swing Chart Technical Forecast
The direction of the March E-mini S&P 500 Index on Tuesday is likely to be determined by trader reaction to 4786.00.
Bullish Scenario
A sustained move over 4786.00 will indicate the presence of buyers. Taking out the intraday high at 4808.25 will indicate the buying is getting stronger. This could trigger an acceleration to the upside since there is no resistance at an all-time high. Investors have to make the resistance by stopping their buying.
Bearish Scenario
A sustained move under 4786.00 will signal the presence of sellers. The first downside target is 4777.50.
Crossing under 4777.50 will indicate the selling pressure is getting stronger. This could trigger a further break into the main bottom at 4747.50.
Taking out 4747.50 will change the main trend to down. This could trigger an acceleration to the downside with 4663.75 to 4630.00 the next major target zone.
For a look at all of today’s economic events, check out our economic calendar.
This article was originally posted on FX Empire
