Earnings growth of 1.1% over 3 years hasn't been enough to translate into positive returns for TP ICAP Group (LON:TCAP) shareholders
Many investors define successful investing as beating the market average over the long term. But if you try your hand at stock picking, your risk returning less than the market. Unfortunately, that's been the case for longer term TP ICAP Group PLC (LON:TCAP) shareholders, since the share price is down 59% in the last three years, falling well short of the market return of around 24%. The falls have accelerated recently, with the share price down 19% in the last three months.
With the stock having lost 7.7% in the past week, it's worth taking a look at business performance and seeing if there's any red flags.
See our latest analysis for TP ICAP Group
While the efficient markets hypothesis continues to be taught by some, it has been proven that markets are over-reactive dynamic systems, and investors are not always rational. One flawed but reasonable way to assess how sentiment around a company has changed is to compare the earnings per share (EPS) with the share price.
During the unfortunate three years of share price decline, TP ICAP Group actually saw its earnings per share (EPS) improve by 3.3% per year. Given the share price reaction, one might suspect that EPS is not a good guide to the business performance during the period (perhaps due to a one-off loss or gain). Or else the company was over-hyped in the past, and so its growth has disappointed.
After considering the numbers, we'd posit that the the market had higher expectations of EPS growth, three years back. However, taking a look at other business metrics might shed a bit more light on the share price action.
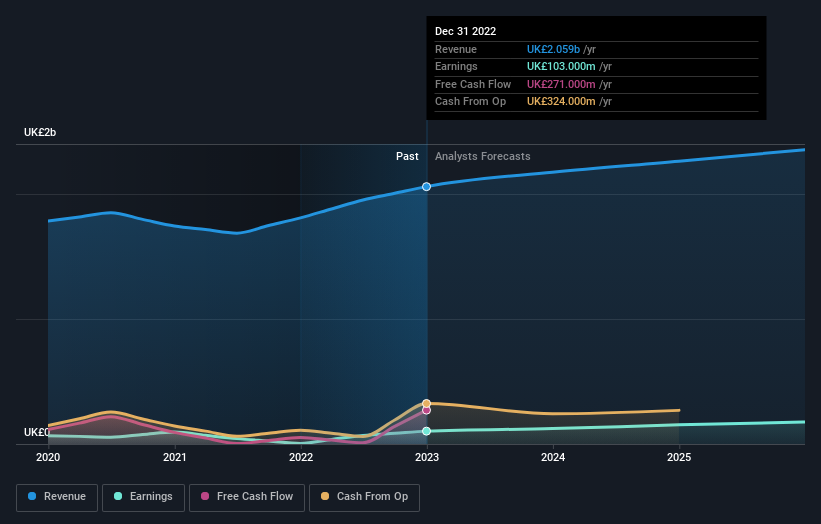
It's quite likely that the declining dividend has caused some investors to sell their shares, pushing the price lower in the process. In contrast it does not seem particularly likely that the revenue levels are a concern for investors.
The graphic below depicts how earnings and revenue have changed over time (unveil the exact values by clicking on the image).
We know that TP ICAP Group has improved its bottom line lately, but what does the future have in store? So we recommend checking out this free report showing consensus forecasts
What About Dividends?
As well as measuring the share price return, investors should also consider the total shareholder return (TSR). The TSR is a return calculation that accounts for the value of cash dividends (assuming that any dividend received was reinvested) and the calculated value of any discounted capital raisings and spin-offs. Arguably, the TSR gives a more comprehensive picture of the return generated by a stock. In the case of TP ICAP Group, it has a TSR of -46% for the last 3 years. That exceeds its share price return that we previously mentioned. And there's no prize for guessing that the dividend payments largely explain the divergence!
A Different Perspective
We're pleased to report that TP ICAP Group shareholders have received a total shareholder return of 46% over one year. Of course, that includes the dividend. That certainly beats the loss of about 3% per year over the last half decade. The long term loss makes us cautious, but the short term TSR gain certainly hints at a brighter future. While it is well worth considering the different impacts that market conditions can have on the share price, there are other factors that are even more important. Consider risks, for instance. Every company has them, and we've spotted 2 warning signs for TP ICAP Group you should know about.
For those who like to find winning investments this free list of growing companies with recent insider purchasing, could be just the ticket.
Please note, the market returns quoted in this article reflect the market weighted average returns of stocks that currently trade on British exchanges.
Have feedback on this article? Concerned about the content? Get in touch with us directly. Alternatively, email editorial-team (at) simplywallst.com.
This article by Simply Wall St is general in nature. We provide commentary based on historical data and analyst forecasts only using an unbiased methodology and our articles are not intended to be financial advice. It does not constitute a recommendation to buy or sell any stock, and does not take account of your objectives, or your financial situation. We aim to bring you long-term focused analysis driven by fundamental data. Note that our analysis may not factor in the latest price-sensitive company announcements or qualitative material. Simply Wall St has no position in any stocks mentioned.
Join A Paid User Research Session
You’ll receive a US$30 Amazon Gift card for 1 hour of your time while helping us build better investing tools for the individual investors like yourself. Sign up here
