Earnings growth of 4.4% over 5 years hasn't been enough to translate into positive returns for Western New England Bancorp (NASDAQ:WNEB) shareholders
For many, the main point of investing is to generate higher returns than the overall market. But in any portfolio, there will be mixed results between individual stocks. At this point some shareholders may be questioning their investment in Western New England Bancorp, Inc. (NASDAQ:WNEB), since the last five years saw the share price fall 28%. Unfortunately the share price momentum is still quite negative, with prices down 14% in thirty days. However, we note the price may have been impacted by the broader market, which is down 6.0% in the same time period.
Given the past week has been tough on shareholders, let's investigate the fundamentals and see what we can learn.
See our latest analysis for Western New England Bancorp
To paraphrase Benjamin Graham: Over the short term the market is a voting machine, but over the long term it's a weighing machine. One imperfect but simple way to consider how the market perception of a company has shifted is to compare the change in the earnings per share (EPS) with the share price movement.
While the share price declined over five years, Western New England Bancorp actually managed to increase EPS by an average of 24% per year. Given the share price reaction, one might suspect that EPS is not a good guide to the business performance during the period (perhaps due to a one-off loss or gain). Or possibly, the market was previously very optimistic, so the stock has disappointed, despite improving EPS.
Because of the sharp contrast between the EPS growth rate and the share price growth, we're inclined to look to other metrics to understand the changing market sentiment around the stock.
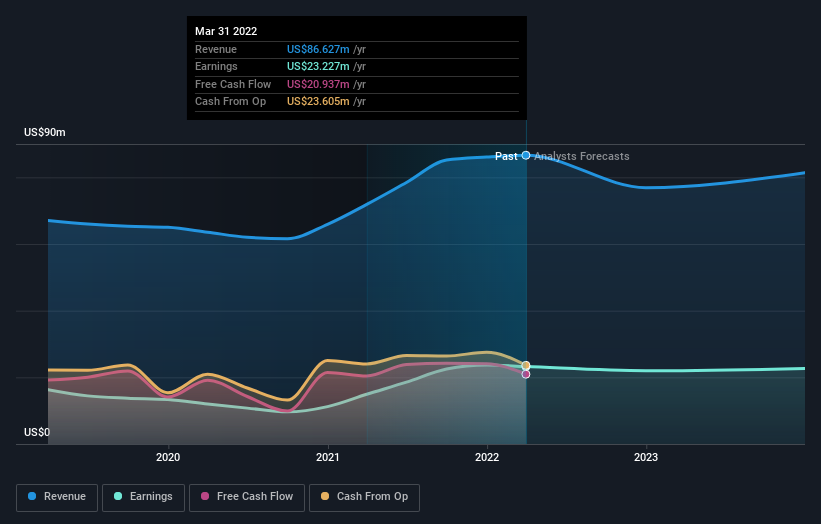
In contrast to the share price, revenue has actually increased by 6.6% a year in the five year period. A more detailed examination of the revenue and earnings may or may not explain why the share price languishes; there could be an opportunity.
The graphic below depicts how earnings and revenue have changed over time (unveil the exact values by clicking on the image).
We know that Western New England Bancorp has improved its bottom line lately, but what does the future have in store? So we recommend checking out this free report showing consensus forecasts
What About Dividends?
It is important to consider the total shareholder return, as well as the share price return, for any given stock. The TSR is a return calculation that accounts for the value of cash dividends (assuming that any dividend received was reinvested) and the calculated value of any discounted capital raisings and spin-offs. It's fair to say that the TSR gives a more complete picture for stocks that pay a dividend. As it happens, Western New England Bancorp's TSR for the last 5 years was -20%, which exceeds the share price return mentioned earlier. And there's no prize for guessing that the dividend payments largely explain the divergence!
A Different Perspective
While it's certainly disappointing to see that Western New England Bancorp shares lost 7.2% throughout the year, that wasn't as bad as the market loss of 20%. Given the total loss of 4% per year over five years, it seems returns have deteriorated in the last twelve months. Whilst Baron Rothschild does tell the investor "buy when there's blood in the streets, even if the blood is your own", buyers would need to examine the data carefully to be comfortable that the business itself is sound. I find it very interesting to look at share price over the long term as a proxy for business performance. But to truly gain insight, we need to consider other information, too. Case in point: We've spotted 2 warning signs for Western New England Bancorp you should be aware of.
Of course, you might find a fantastic investment by looking elsewhere. So take a peek at this free list of companies we expect will grow earnings.
Please note, the market returns quoted in this article reflect the market weighted average returns of stocks that currently trade on US exchanges.
Have feedback on this article? Concerned about the content? Get in touch with us directly. Alternatively, email editorial-team (at) simplywallst.com.
This article by Simply Wall St is general in nature. We provide commentary based on historical data and analyst forecasts only using an unbiased methodology and our articles are not intended to be financial advice. It does not constitute a recommendation to buy or sell any stock, and does not take account of your objectives, or your financial situation. We aim to bring you long-term focused analysis driven by fundamental data. Note that our analysis may not factor in the latest price-sensitive company announcements or qualitative material. Simply Wall St has no position in any stocks mentioned.
