Elanco Animal Health Inc (ELAN): A Deep Dive into Its Performance Metrics
Long-established in the Drug Manufacturers industry, Elanco Animal Health Inc (NYSE:ELAN) has enjoyed a stellar reputation. However, it has recently witnessed a daily loss of 4.76%, juxtaposed with a three-month change of -3.41%. Fresh insights from the GF Score hint at potential headwinds. Notably, its diminished rankings in financial strength, growth, and valuation suggest that the company might not live up to its historical performance. Join us as we dive deep into these pivotal metrics to unravel the evolving narrative of Elanco Animal Health Inc.
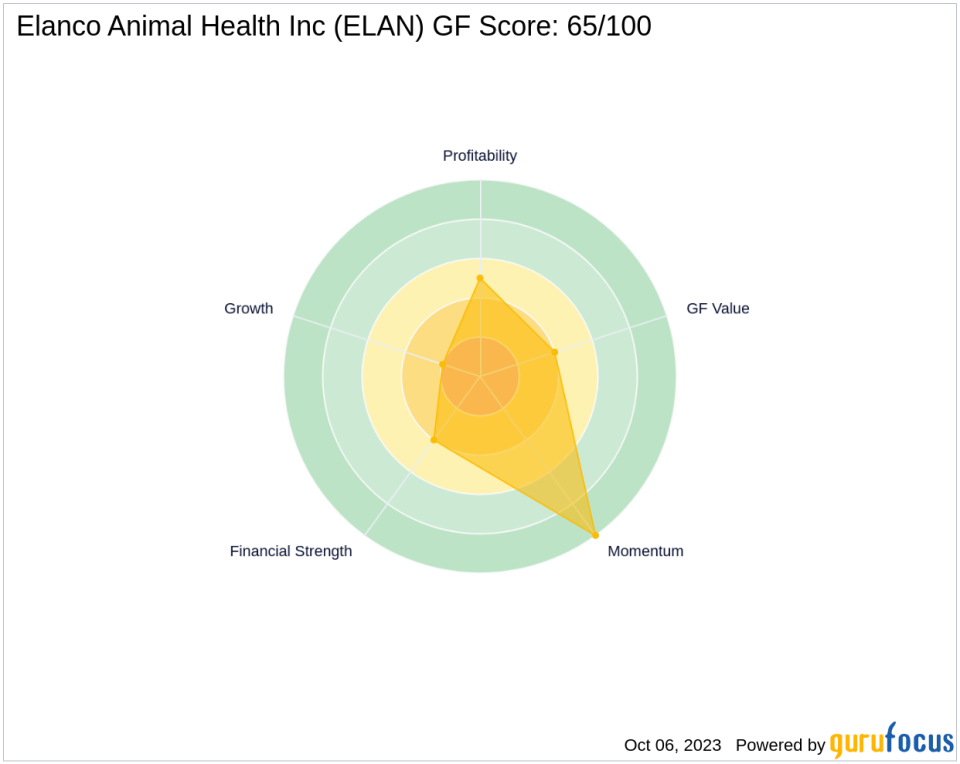
Understanding the GF Score
The GF Score is a stock performance ranking system developed by GuruFocus using five aspects of valuation, which has been found to be closely correlated to the long-term performances of stocks by backtesting from 2006 to 2021. The stocks with a higher GF Score generally generate higher returns than those with a lower GF Score. Therefore, when picking stocks, investors should invest in companies with high GF Scores. The GF Score ranges from 0 to 100, with 100 as the highest rank.
Financial strength rank: 4/10
Profitability rank: 5/10
Growth rank: 2/10
GF Value rank: 4/10
Momentum rank: 10/10
Based on the above method, GuruFocus assigned Elanco Animal Health Inc the GF Score of 65 out of 100, which signals poor future outperformance potential.
Elanco Animal Health Inc: A Snapshot
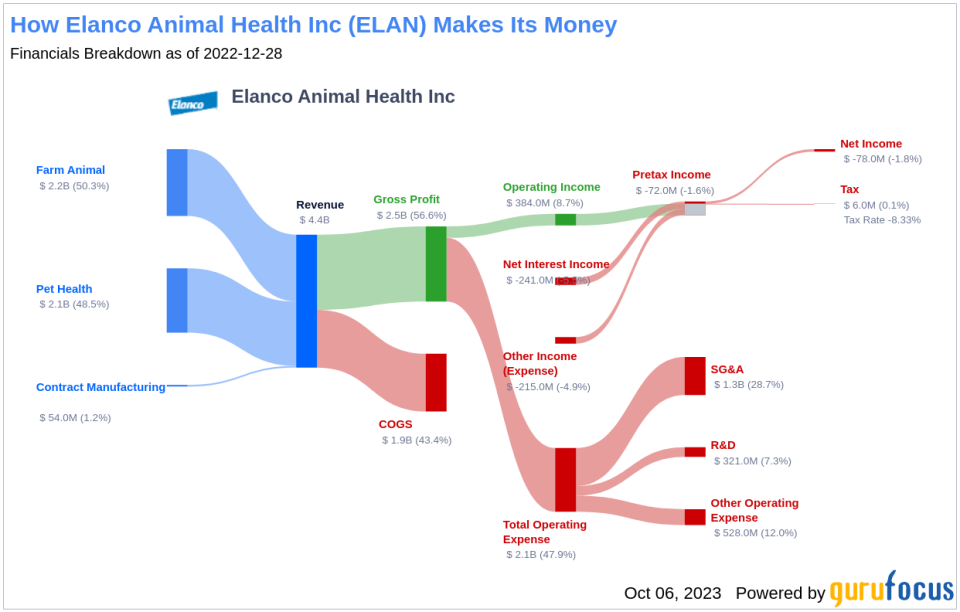
With a market cap of $4.58 billion and sales of $4.32 billion, Elanco Animal Health Inc is an animal health company that is engaged in innovating, developing, manufacturing, and marketing products for companion and food animals. The company operates globally and sells its products in over 90 countries. It offers a range of food animal products used in cattle, sheep, goats, and swine production. The company's operating margin stands at 7.98%.
Financial Strength Analysis
Elanco Animal Health Inc's financial strength indicators present some concerning insights about the company's balance sheet health. The company's interest coverage ratio of 1.33 positions it worse than 89.47% of 684 companies in the Drug Manufacturers industry. This ratio highlights potential challenges the company might face when handling its interest expenses on outstanding debt. It's worth noting that the esteemed investor Benjamin Graham typically favored companies with an interest coverage ratio of at least five.
The company's Altman Z-Score is just 0.76, which is below the distress zone of 1.81. This suggests that the company may face financial distress over the next few years. Additionally, the company's low cash-to-debt ratio at 0.06 indicates a struggle in handling existing debt levels. Furthermore, the company's debt-to-Ebitda ratio is 7.14, which is above Joel Tillinghast's warning level of 4 and is worse than 89.17% of 628 companies in the Drug Manufacturers industry. Tillinghast said in his book Big Money Think's Small: Biases, Blind Spots, and Smarter Investing that a high debt-to-Ebitda ratio can be a red flag unless tangible assets cover the debt.
Profitability Analysis
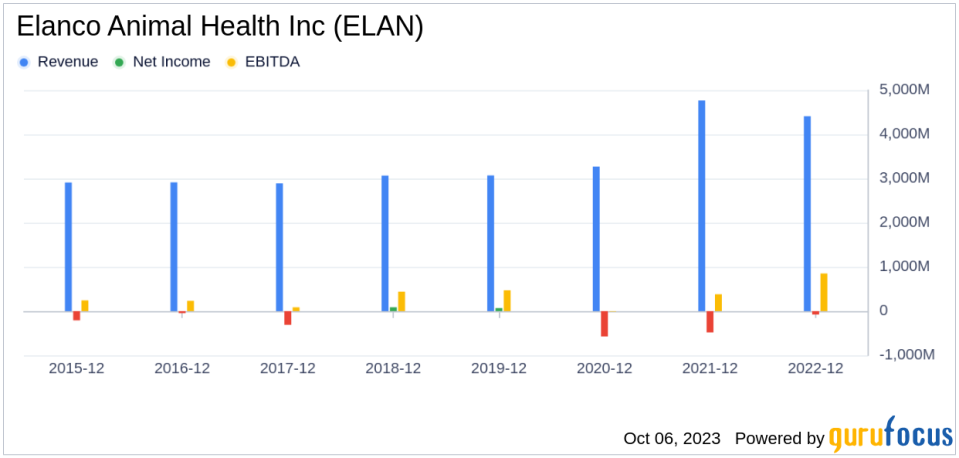
Elanco Animal Health Inc's low Profitability rank can also raise warning signals. Elanco Animal Health Inc's Operating Margin has declined over the past five years ((-14.92%)), as shown by the following data: 2018: 10.23; 2019: 12.08; 2020: -2.51; 2021: 6.38; 2022: 8.71; .
Growth Prospects
A lack of significant growth is another area where Elanco Animal Health Inc seems to falter, as evidenced by the company's low Growth rank.
Conclusion
Given Elanco Animal Health Inc's financial strength, profitability, and growth metrics, the GF Score highlights the firm's unparalleled position for potential underperformance. While the company has a strong reputation in the Drug Manufacturers industry, its recent performance and financial indicators suggest that it may struggle to maintain its historical success. Investors should consider these factors when making investment decisions.
GuruFocus Premium members can find more companies with strong GF Scores using the following screener link: GF Score Screen
This article, generated by GuruFocus, is designed to provide general insights and is not tailored financial advice. Our commentary is rooted in historical data and analyst projections, utilizing an impartial methodology, and is not intended to serve as specific investment guidance. It does not formulate a recommendation to purchase or divest any stock and does not consider individual investment objectives or financial circumstances. Our objective is to deliver long-term, fundamental data-driven analysis. Be aware that our analysis might not incorporate the most recent, price-sensitive company announcements or qualitative information. GuruFocus holds no position in the stocks mentioned herein.
This article first appeared on GuruFocus.
