Elastic NV's Meteoric Rise: Unpacking the 25% Surge in Just 3 Months
Elastic NV (NYSE:ESTC), a software company based in Mountain View, California, has seen a significant change in its stock price over the past week and three months. The company's stock price has decreased by 3.91% over the past week but has increased by 24.62% over the past three months. Currently, the stock is priced at $78.58 with a market cap of $7.73 billion. According to the GF Value, which calculates a stock's intrinsic value using historical multiples, past performance adjustments, and future business estimates, the stock is significantly undervalued with a current GF Value of $119.59. This is a decrease from the past GF Value of $174.62, indicating that the stock was also significantly undervalued three months ago.
Introduction to Elastic NV (NYSE:ESTC)
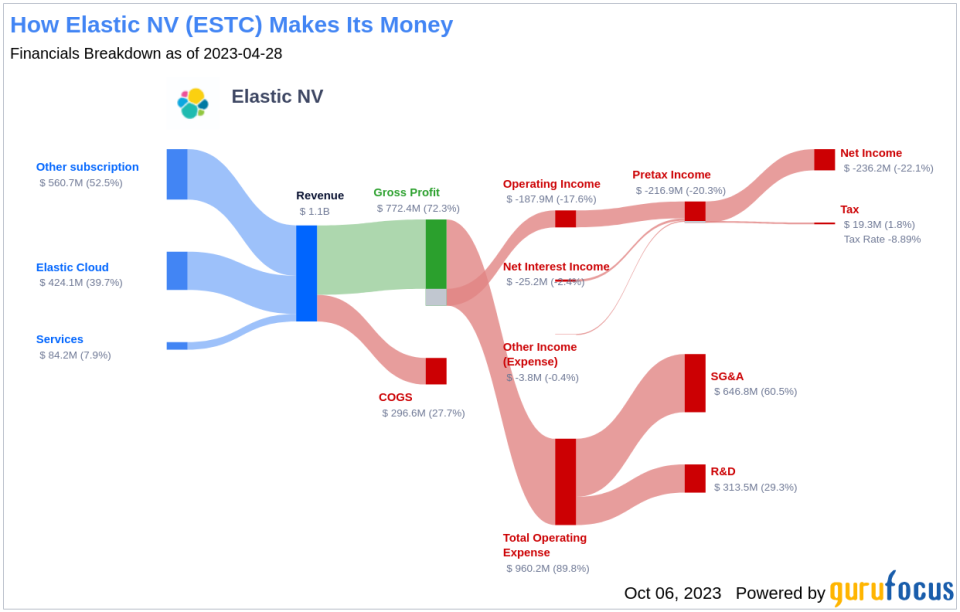
Elastic NV operates in the software industry, focusing on search-adjacent products. Its search engine allows it to process both structured and unstructured data while gleaning insights from that data. The firm's primary focus is on enterprise search, observability, and security.
Profitability Analysis of Elastic NV (NYSE:ESTC)
When it comes to profitability, Elastic NV has a Profitability Rank of 3/10, indicating a lower level of profitability. The company's Operating Margin is -14.63%, which is better than 28.85% of companies in the same industry. Its ROE is -54.30%, better than 14.33% of companies in the same industry. The ROA is -13.06%, better than 26.62% of companies in the same industry, and the ROIC is -19.57%, better than 24.19% of companies in the same industry.
Growth Analysis of Elastic NV (NYSE:ESTC)
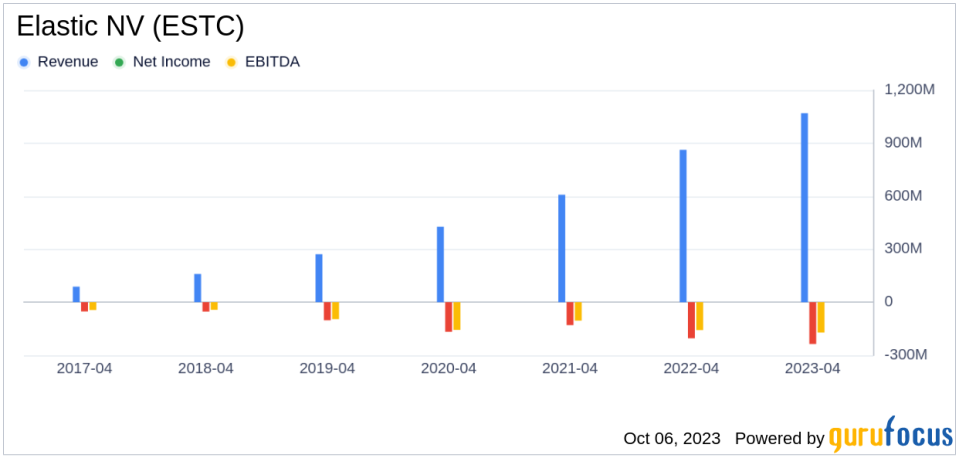
Elastic NV has a Growth Rank of 7/10, indicating a higher level of growth. The company's 3-Year Revenue Growth Rate per Share is 27.20%, better than 82.75% of companies in the same industry. Its 5-Year Revenue Growth Rate per Share is 31.10%, better than 91.52% of companies in the same industry. The Total Revenue Growth Rate (Future 3Y To 5Y Est) is 18.34%, better than 75.05% of companies in the same industry. The 3-Year EPS without NRI Growth Rate is -5.20%, better than 34.2% of companies in the same industry. The 5-Year EPS without NRI Growth Rate is -16.80%, better than 10.99% of companies in the same industry. The EPS without NRI Growth Rate(Future 3Y To 5Y Est) is 63.59%, better than 97.52% of companies in the same industry.
Major Holders of Elastic NV (NYSE:ESTC) Stock
The major holders of Elastic NV stock include Baillie Gifford (Trades, Portfolio), which holds 7.79% of shares, Jim Simons (Trades, Portfolio), who holds 0.21% of shares, and Joel Greenblatt (Trades, Portfolio), who holds 0.02% of shares.
Competitors of Elastic NV (NYSE:ESTC)
Elastic NV faces competition from several companies within the same industry. These include Coupa Software Inc(COUP), with a market cap of $6.12 billion, RingCentral Inc(NYSE:RNG), with a market cap of $2.74 billion, and Procore Technologies Inc(NYSE:PCOR), with a market cap of $9.57 billion.
Conclusion
In conclusion, Elastic NV has seen a significant increase in its stock price over the past three months, despite a decrease over the past week. The company's profitability rank is lower, but its growth rank is higher. Major holders of the stock include Baillie Gifford (Trades, Portfolio), Jim Simons (Trades, Portfolio), and Joel Greenblatt (Trades, Portfolio). The company faces competition from Coupa Software Inc, RingCentral Inc, and Procore Technologies Inc. These factors should be considered by potential investors when evaluating the stock.
This article, generated by GuruFocus, is designed to provide general insights and is not tailored financial advice. Our commentary is rooted in historical data and analyst projections, utilizing an impartial methodology, and is not intended to serve as specific investment guidance. It does not formulate a recommendation to purchase or divest any stock and does not consider individual investment objectives or financial circumstances. Our objective is to deliver long-term, fundamental data-driven analysis. Be aware that our analysis might not incorporate the most recent, price-sensitive company announcements or qualitative information. GuruFocus holds no position in the stocks mentioned herein.
This article first appeared on GuruFocus.
