Energizer (ENR) Q1 Earnings & Sales Beat Estimates, Dip Y/Y
Energizer Holdings, Inc. ENR reported first-quarter fiscal 2024 results, wherein its top and bottom lines surpassed the Zacks Consensus Estimate. However, both metrics declined year over year.
Energizer Holdings, Inc. Price, Consensus and EPS Surprise
Energizer Holdings, Inc. price-consensus-eps-surprise-chart | Energizer Holdings, Inc. Quote
Q1 Metrics
Energizer’s adjusted earnings of 59 cents per share beat the Zacks Consensus Estimate of 57 cents per share. However, the bottom line decreased 18.1% from the year-ago quarter’s reported figure.
This Zacks Rank #2 (Buy) company reported net sales of $716.6 million, which beat the Zacks Consensus Estimate of $713 million but decreased 6.3% from the year-ago quarter’s reading. Organic sales declined 7.4% in the fiscal first quarter. We expected organic sales to decline 7.1% in the quarter.
The battery business experienced a 7% decrease in sales volume in the fiscal first quarter, stemming from holiday orders placed earlier than the previous year, consequently boosting sales in the preceding quarter and soft performance at non-tracked channels. Concurrently, pricing remained relatively flat during the same period, leading to a net year-over-year decrease in organic sales by 0.4%.
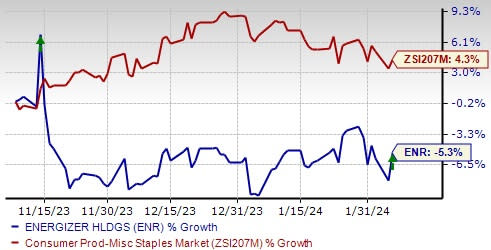
Image Source: Zacks Investment Research
Segments in Detail
Revenues of Energizer's Batteries & Lights segment dropped 8% year over year to $617.8 million, in line with our anticipated rate of decline for the segment. We note that segmental profit decreased 4.3% to $132.4 million.
Meanwhile, revenues in the Auto Care segment rose 5.7% to $98.8 million from the year-ago period, surpassing our projected 2% growth in segmental revenues. However, we note that segmental profit fell sharply 34.9% to $6.9 million.
Margins
In the fiscal first quarter, Energizer’s adjusted gross margin expanded 50 basis points to 39.5%, driven primarily by the Project Momentum savings of $16 million. However, this positive effect was marginally impacted by changes in the product mix, higher product costs and lower pricing. We expected a gross margin expansion of 20 basis points.
Excluding restructuring costs, adjusted SG&A expenses increased 3.2% year over year to $117.8 million. This increase was driven by higher labor and benefit expenses, factoring fees, and an environmental charge related to a legacy facility that the company has sold. Adjusted SG&A costs, as a rate of net sales, came in at 16.4% compared with the 14.9% recorded in the prior-year quarter. We had expected SG&A expenses, as a percentage of net sales, to deleverage 90 basis points to 15.8% in the quarter.
Adjusted EBITDA came in at $132.9 million, down 8.7% year over year, whereas the adjusted EBITDA margin contracted 50 basis points to 18.5%.
Other Financial Details
As of Dec 31, 2023, Energizer’s cash and cash equivalents were $241.7 million, with long-term debt of $3,303.3 million and shareholders' equity of $170.6 million. In the fiscal first quarter, ENR paid down $78 million of debt. At the end of the quarter, the company’s net debt to adjusted EBITDA was 5.3 times. Subsequent to the quarter, it paid down an additional $58 million of long-term debt.
The operating cash flow for the fiscal first quarter was $178.1 million and the free cash flow was $152.6 million.
Outlook
For fiscal 2024, Energizer expects organic revenues between flat and a low-single-digit decline. The company anticipates its adjusted EBITDA between $600 million and $620 million, with adjusted earnings per share between $3.10 and $3.30.
For the fiscal second quarter, organic revenues are expected to decline 2-3% and adjusted earnings per share are anticipated to be 65-70 cents.
Initially, Project Momentum savings were estimated to be $130-$150 million throughout the program's duration. Markedly, management anticipates savings of $160-$180 million over the program's lifetime. The cash costs required to achieve these savings are projected between $140-$150 million.
For fiscal 2024, expected savings from Project Momentum are pegged at $55-$65 million, with one-time cash costs of $60-$70 million.
Shares of ENR have declined 5.3% in the past three months against the industry’s growth of 4.3%.
Other Key Picks
Some top-ranked stocks from the same sector are Lancaster Colony Corporation LANC, Treehouse Foods THS and Inter Parfums, Inc. IPAR.
Lancaster Colony is a manufacturer and marketer of specialty food products for the retail and foodservice markets. LANC currently carries a Zacks Rank #1 (Strongly Buy). You can see the complete list of today’s Zacks #1 Rank stocks here.
The Zacks Consensus Estimate for Lancaster Colony’s current fiscal-year earnings and sales indicates growth of 29.5% and 3%, respectively, from the fiscal 2023 reported figures. LANC has a negative trailing four-quarter average earnings surprise of 1%.
Treehouse Foods is a manufacturer of packaged foods and beverages. The company currently has a Zacks Rank #2.
The Zacks Consensus Estimate for Treehouse Foods’ current financial-year earnings indicates growth of 106% from the 2022 reported figures. THS has a trailing four-quarter average earnings surprise of 26.5%.
Inter Parfums is engaged in the manufacturing, distribution and marketing of a wide range of fragrances and related products. The company currently carries a Zacks Rank #2.
The Zacks Consensus Estimate for Inter Parfums’ current financial-year earnings and sales indicates growth of 20.2% and 21.7%, respectively, from the 2022 reported figures. IPAR has a trailing four-quarter average earnings surprise of 45.7%.
Want the latest recommendations from Zacks Investment Research? Today, you can download 7 Best Stocks for the Next 30 Days. Click to get this free report
Energizer Holdings, Inc. (ENR) : Free Stock Analysis Report
TreeHouse Foods, Inc. (THS) : Free Stock Analysis Report
Inter Parfums, Inc. (IPAR) : Free Stock Analysis Report
Lancaster Colony Corporation (LANC) : Free Stock Analysis Report
