Is Energy Fuels (UUUU) Too Good to Be True? A Comprehensive Analysis of a Potential Value Trap
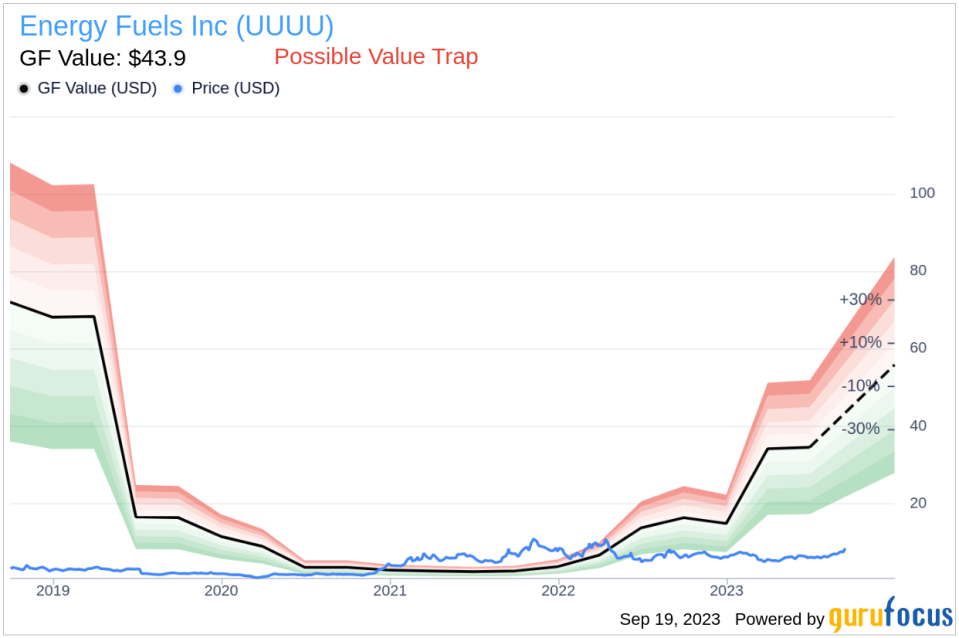
Value-focused investors are always on the hunt for stocks that are priced below their intrinsic value. One such stock that merits attention is Energy Fuels Inc (UUUU). The stock, which is currently priced at 8.13, recorded a loss of 5.68% in a day and a 3-month increase of 26.83%. The stock's fair valuation is $43.9, as indicated by its GF Value.
Understanding the GF Value
The GF Value represents the current intrinsic value of a stock derived from our exclusive method. The GF Value Line on our summary page gives an overview of the fair value that the stock should be traded at. It is calculated based on three factors:
1. Historical multiples (PE Ratio, PS Ratio, PB Ratio and Price-to-Free-Cash-Flow) that the stock has traded at.
2. GuruFocus adjustment factor based on the company's past returns and growth.
3. Future estimates of the business performance.
Examining the Risk Factors
However, investors need to consider a more in-depth analysis before making an investment decision. Despite its seemingly attractive valuation, certain risk factors associated with Energy Fuels (UUUU) should not be ignored. These risks are primarily reflected through its low Piotroski F-score and a Beneish M-Score of -1.61 that exceeds -1.78, the threshold for potential earnings manipulation. Moreover, the company's revenues and earnings have been on a downward trend over the past five years, which raises a crucial question: Is Energy Fuels a hidden gem or a value trap?
The Beneish M-Score Explained
Developed by Professor Messod Beneish, the Beneish M-Score is based on eight financial variables that reflect different aspects of a company's financial performance and position. These are Days Sales Outstanding (DSO), Gross Margin (GM), Total Long-term Assets Less Property, Plant and Equipment over Total Assets (TATA), change in Revenue (?REV), change in Depreciation and Amortization (?DA), change in Selling, General and Admin expenses (?SGA), change in Debt-to-Asset Ratio (?LVG), and Net Income Less Non-Operating Income and Cash Flow from Operations over Total Assets (?NOATA).
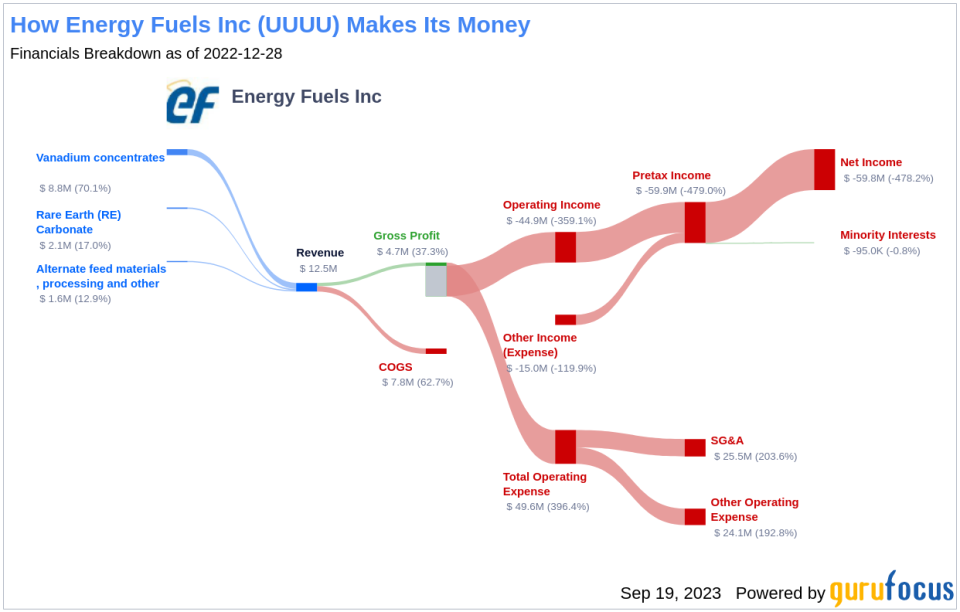
Company Overview
Energy Fuels Inc is a United States-based critical minerals company. The Company mines uranium and produces natural uranium concentrates that are sold to nuclear utilities for the production of carbon-free nuclear energy. It holds two of America's key uranium production centers: The White Mesa Mill in Utah, and the Nichols Ranch ISR Facility in Wyoming. Its producing White Mesa Mill is the only conventional uranium mill in the United States and has a licensed capacity of approximately 8 million pounds of U3O8 per year. Nichols Ranch is in production and has a licensed capacity of approximately 2 million pounds of U3O8 per year. It also produces vanadium. Energy Fuels also owns several licensed and developed uranium and vanadium mines on standby and other projects in development.
Analysing the Gross Margin
The Gross Margin index tracks the evolution of a company's gross profit as a proportion of its revenue. A downward trend could indicate issues such as overproduction or more generous credit terms, both of which are potential red flags for earnings manipulation. By examining the past three years of Energy Fuels's historical data (2021: 0; 2022: 30.98; 2023: 52.11), we find that its Gross Margin has contracted by 30.09%. Such a contraction in the gross margin can negatively impact the company's profitability as it signifies lesser income from each dollar of sales. This could put a strain on the company's capacity to manage operating costs, potentially undermining its financial stability.
Assessing the Asset Quality Ratio
The asset quality ratio, calculated as Total Long-term Assets minus Property, Plant, and Equipment, divided by Total Assets, gauges the proportion of intangible or less tangible assets within a company's asset structure. Analyzing Energy Fuels's asset quality ratio over the past three years (2021: 0.10; 2022: 0.16; 2023: 0.26), an increase might signal underlying issues, such as capitalizing normal operating expenses or goodwill impairment. These factors can inflate assets and mask true operational costs, potentially misrepresenting the company's actual financial position, and raising concerns for investors about its true value and risk profile.
Year-Over-Year Change in Revenue
The Year-Over-Year (YoY) change in Revenue calculates the percentage difference in sales between the previous year and the current year. A notable upswing in this ratio could potentially signal aggressive income recognition or sales manipulation tactics. Delving into Energy Fuels's revenue data over the past three years (2021: 1.68; 2022: 11.78; 2023: 29.59), it's apparent that there has been a significant surge in revenue in the last 12 months, with a rise of 601.19 %.
Change in SG&A Expenses
The change in Selling, General, and Administrative (SG&A) expenses provides insight into a company's operational costs, encompassing expenses related to selling products and managing the business. Examining Energy Fuels's SG&A data over the past three years (2021: 19.51; 2022: 13.32; 2023: 29.75), an unexpected decrease may raise eyebrows. While reducing these expenses can be a sign of improved efficiency, an abrupt or unexplained decrease might indicate cost-cutting measures taken to artificially inflate earnings. By selectively reducing SG&A expenses, a company can create the illusion of higher profitability and operational efficiency. However, if these reductions are achieved by neglecting essential functions like marketing, customer service, or quality control, it might result in long-term negative effects on the company's growth, reputation, and sustainability. Hence, a decrease in SG&A must be carefully evaluated within the broader context of the company's strategy, industry norms, and competitive landscape to determine if it signals potential earnings manipulation or a legitimate improvement in operational efficiency.
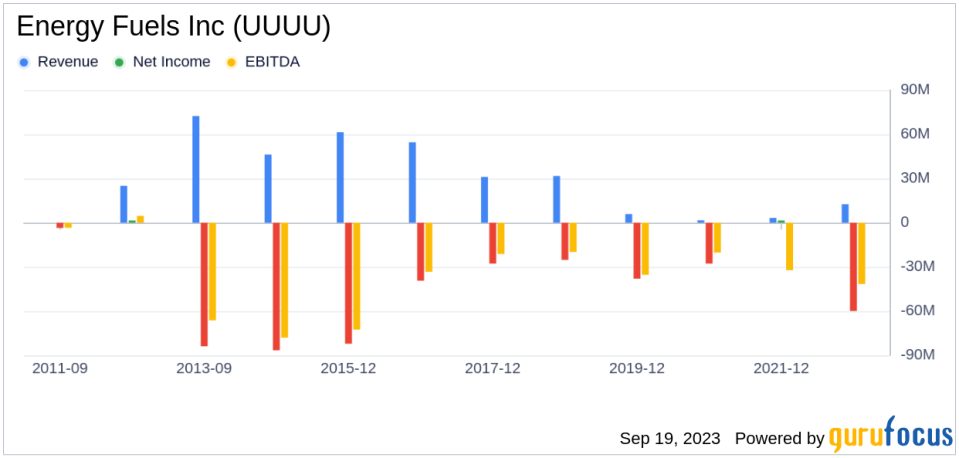
Bearish Signs: Declining Revenues and Earnings
One of the telltale indicators of a company's potential trouble is a sustained decline in revenues. In the case of Energy Fuels, both the revenue per share (evident from the last five years' TTM data: 2019: 0.09; 2020: 0.02; 2021: 0.01; 2022: 0.07; 2023: 0.19; ) and the 5-year revenue growth rate (-41.3%) have been on a consistent downward trajectory. This pattern may point to underlying challenges such as diminishing demand for Energy Fuels's products, or escalating competition in its market sector. Either scenario can pose serious risks to the company's future performance, warranting a thorough analysis by investors.
The Red Flag: Sluggish Earnings Growth
Despite its low price-to-fair-value ratio, Energy Fuels's falling revenues and earnings cast a long shadow over its investment attractiveness. A low price relative to intrinsic value can indeed suggest an investment opportunity, but only if the company's fundamentals are sound or improving. In Steelcase's case, the declining revenues, EBITDA, and earnings growth suggest that the company's issues may be more than just cyclical fluctuations.
Conclusion
Without a clear turnaround strategy, there's a risk that the company's performance could continue to deteriorate, leading to further price declines. In such a scenario, the low price-to-GF-Value ratio may be more indicative of a value trap than a value opportunity.
To find out the high quality companies that may deliver above average returns, please check out GuruFocus High Quality Low Capex Screener.Investors can find stocks with good revenue and earnings growth using GuruFocus' Peter Lynch Growth with Low Valuation Screener.
This article first appeared on GuruFocus.
