Is Enerpac Tool Group Corp.'s (NYSE:EPAC) Latest Stock Performance A Reflection Of Its Financial Health?
Most readers would already be aware that Enerpac Tool Group's (NYSE:EPAC) stock increased significantly by 13% over the past month. Given that the market rewards strong financials in the long-term, we wonder if that is the case in this instance. Particularly, we will be paying attention to Enerpac Tool Group's ROE today.
Return on equity or ROE is a key measure used to assess how efficiently a company's management is utilizing the company's capital. In simpler terms, it measures the profitability of a company in relation to shareholder's equity.
Check out our latest analysis for Enerpac Tool Group
How Do You Calculate Return On Equity?
ROE can be calculated by using the formula:
Return on Equity = Net Profit (from continuing operations) ÷ Shareholders' Equity
So, based on the above formula, the ROE for Enerpac Tool Group is:
16% = US$54m ÷ US$327m (Based on the trailing twelve months to August 2023).
The 'return' is the yearly profit. That means that for every $1 worth of shareholders' equity, the company generated $0.16 in profit.
What Is The Relationship Between ROE And Earnings Growth?
Thus far, we have learned that ROE measures how efficiently a company is generating its profits. Based on how much of its profits the company chooses to reinvest or "retain", we are then able to evaluate a company's future ability to generate profits. Generally speaking, other things being equal, firms with a high return on equity and profit retention, have a higher growth rate than firms that don’t share these attributes.
Enerpac Tool Group's Earnings Growth And 16% ROE
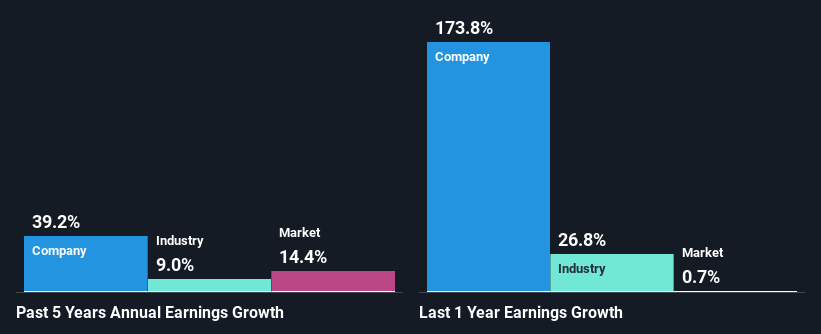
To start with, Enerpac Tool Group's ROE looks acceptable. Further, the company's ROE is similar to the industry average of 15%. This probably goes some way in explaining Enerpac Tool Group's significant 39% net income growth over the past five years amongst other factors. However, there could also be other drivers behind this growth. For instance, the company has a low payout ratio or is being managed efficiently.
Next, on comparing with the industry net income growth, we found that Enerpac Tool Group's growth is quite high when compared to the industry average growth of 9.0% in the same period, which is great to see.
The basis for attaching value to a company is, to a great extent, tied to its earnings growth. It’s important for an investor to know whether the market has priced in the company's expected earnings growth (or decline). Doing so will help them establish if the stock's future looks promising or ominous. What is EPAC worth today? The intrinsic value infographic in our free research report helps visualize whether EPAC is currently mispriced by the market.
Is Enerpac Tool Group Making Efficient Use Of Its Profits?
Enerpac Tool Group's ' three-year median payout ratio is on the lower side at 8.3% implying that it is retaining a higher percentage (92%) of its profits. So it seems like the management is reinvesting profits heavily to grow its business and this reflects in its earnings growth number.
Besides, Enerpac Tool Group has been paying dividends for at least ten years or more. This shows that the company is committed to sharing profits with its shareholders.
Summary
Overall, we are quite pleased with Enerpac Tool Group's performance. Particularly, we like that the company is reinvesting heavily into its business, and at a high rate of return. Unsurprisingly, this has led to an impressive earnings growth. With that said, the latest industry analyst forecasts reveal that the company's earnings growth is expected to slow down. Are these analysts expectations based on the broad expectations for the industry, or on the company's fundamentals? Click here to be taken to our analyst's forecasts page for the company.
Have feedback on this article? Concerned about the content? Get in touch with us directly. Alternatively, email editorial-team (at) simplywallst.com.
This article by Simply Wall St is general in nature. We provide commentary based on historical data and analyst forecasts only using an unbiased methodology and our articles are not intended to be financial advice. It does not constitute a recommendation to buy or sell any stock, and does not take account of your objectives, or your financial situation. We aim to bring you long-term focused analysis driven by fundamental data. Note that our analysis may not factor in the latest price-sensitive company announcements or qualitative material. Simply Wall St has no position in any stocks mentioned.
