Enerpac Tool Group Corp.'s (NYSE:EPAC) Stock On An Uptrend: Could Fundamentals Be Driving The Momentum?
Enerpac Tool Group's (NYSE:EPAC) stock is up by a considerable 55% over the past three months. Given that stock prices are usually aligned with a company's financial performance in the long-term, we decided to study its financial indicators more closely to see if they had a hand to play in the recent price move. Particularly, we will be paying attention to Enerpac Tool Group's ROE today.
Return on Equity or ROE is a test of how effectively a company is growing its value and managing investors’ money. Put another way, it reveals the company's success at turning shareholder investments into profits.
Check out our latest analysis for Enerpac Tool Group
How To Calculate Return On Equity?
ROE can be calculated by using the formula:
Return on Equity = Net Profit (from continuing operations) ÷ Shareholders' Equity
So, based on the above formula, the ROE for Enerpac Tool Group is:
6.8% = US$23m ÷ US$334m (Based on the trailing twelve months to November 2022).
The 'return' is the profit over the last twelve months. So, this means that for every $1 of its shareholder's investments, the company generates a profit of $0.07.
What Is The Relationship Between ROE And Earnings Growth?
So far, we've learned that ROE is a measure of a company's profitability. Based on how much of its profits the company chooses to reinvest or "retain", we are then able to evaluate a company's future ability to generate profits. Assuming all else is equal, companies that have both a higher return on equity and higher profit retention are usually the ones that have a higher growth rate when compared to companies that don't have the same features.
Enerpac Tool Group's Earnings Growth And 6.8% ROE
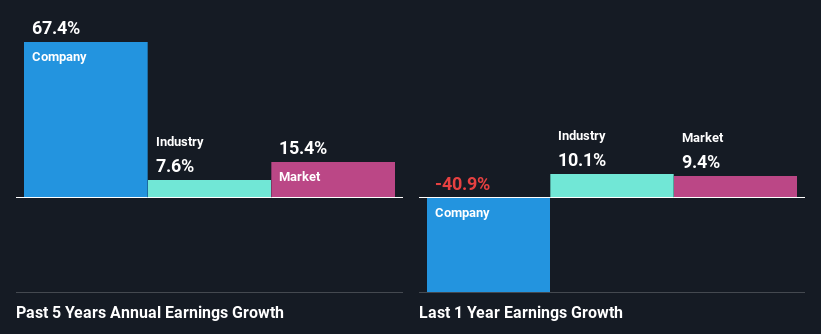
When you first look at it, Enerpac Tool Group's ROE doesn't look that attractive. A quick further study shows that the company's ROE doesn't compare favorably to the industry average of 13% either. However, we we're pleasantly surprised to see that Enerpac Tool Group grew its net income at a significant rate of 67% in the last five years. Therefore, there could be other reasons behind this growth. For example, it is possible that the company's management has made some good strategic decisions, or that the company has a low payout ratio.
We then compared Enerpac Tool Group's net income growth with the industry and we're pleased to see that the company's growth figure is higher when compared with the industry which has a growth rate of 7.6% in the same period.
The basis for attaching value to a company is, to a great extent, tied to its earnings growth. What investors need to determine next is if the expected earnings growth, or the lack of it, is already built into the share price. Doing so will help them establish if the stock's future looks promising or ominous. One good indicator of expected earnings growth is the P/E ratio which determines the price the market is willing to pay for a stock based on its earnings prospects. So, you may want to check if Enerpac Tool Group is trading on a high P/E or a low P/E, relative to its industry.
Is Enerpac Tool Group Efficiently Re-investing Its Profits?
Enerpac Tool Group has a really low three-year median payout ratio of 10%, meaning that it has the remaining 90% left over to reinvest into its business. So it seems like the management is reinvesting profits heavily to grow its business and this reflects in its earnings growth number.
Moreover, Enerpac Tool Group is determined to keep sharing its profits with shareholders which we infer from its long history of paying a dividend for at least ten years.
Summary
Overall, we feel that Enerpac Tool Group certainly does have some positive factors to consider. Even in spite of the low rate of return, the company has posted impressive earnings growth as a result of reinvesting heavily into its business. While we won't completely dismiss the company, what we would do, is try to ascertain how risky the business is to make a more informed decision around the company. You can see the 2 risks we have identified for Enerpac Tool Group by visiting our risks dashboard for free on our platform here.
Have feedback on this article? Concerned about the content? Get in touch with us directly. Alternatively, email editorial-team (at) simplywallst.com.
This article by Simply Wall St is general in nature. We provide commentary based on historical data and analyst forecasts only using an unbiased methodology and our articles are not intended to be financial advice. It does not constitute a recommendation to buy or sell any stock, and does not take account of your objectives, or your financial situation. We aim to bring you long-term focused analysis driven by fundamental data. Note that our analysis may not factor in the latest price-sensitive company announcements or qualitative material. Simply Wall St has no position in any stocks mentioned.
Join A Paid User Research Session
You’ll receive a US$30 Amazon Gift card for 1 hour of your time while helping us build better investing tools for the individual investors like yourself. Sign up here
