Ennis, Inc.'s (NYSE:EBF) Stock Has Shown Weakness Lately But Financial Prospects Look Decent: Is The Market Wrong?
Ennis (NYSE:EBF) has had a rough month with its share price down 4.5%. However, stock prices are usually driven by a company’s financials over the long term, which in this case look pretty respectable. In this article, we decided to focus on Ennis' ROE.
Return on equity or ROE is a key measure used to assess how efficiently a company's management is utilizing the company's capital. In short, ROE shows the profit each dollar generates with respect to its shareholder investments.
Check out our latest analysis for Ennis
How Do You Calculate Return On Equity?
The formula for return on equity is:
Return on Equity = Net Profit (from continuing operations) ÷ Shareholders' Equity
So, based on the above formula, the ROE for Ennis is:
12% = US$38m ÷ US$315m (Based on the trailing twelve months to August 2022).
The 'return' is the yearly profit. One way to conceptualize this is that for each $1 of shareholders' capital it has, the company made $0.12 in profit.
Why Is ROE Important For Earnings Growth?
So far, we've learned that ROE is a measure of a company's profitability. Based on how much of its profits the company chooses to reinvest or "retain", we are then able to evaluate a company's future ability to generate profits. Assuming everything else remains unchanged, the higher the ROE and profit retention, the higher the growth rate of a company compared to companies that don't necessarily bear these characteristics.
Ennis' Earnings Growth And 12% ROE
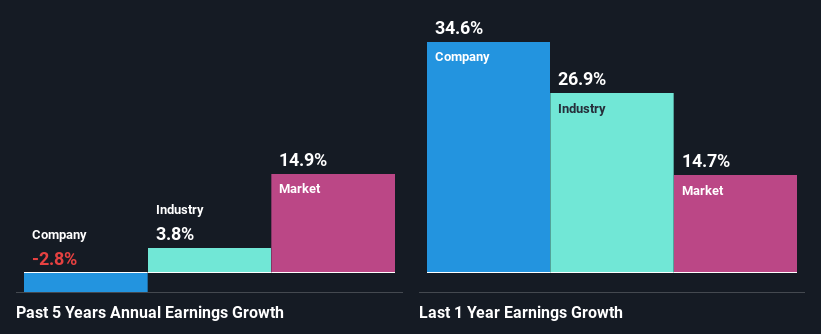
At first glance, Ennis seems to have a decent ROE. Further, the company's ROE is similar to the industry average of 12%. However, while Ennis has a pretty respectable ROE, its five year net income decline rate was 2.8% . We reckon that there could be some other factors at play here that are preventing the company's growth. For example, it could be that the company has a high payout ratio or the business has allocated capital poorly, for instance.
However, when we compared Ennis' growth with the industry we found that while the company's earnings have been shrinking, the industry has seen an earnings growth of 3.8% in the same period. This is quite worrisome.
The basis for attaching value to a company is, to a great extent, tied to its earnings growth. What investors need to determine next is if the expected earnings growth, or the lack of it, is already built into the share price. Doing so will help them establish if the stock's future looks promising or ominous. What is EBF worth today? The intrinsic value infographic in our free research report helps visualize whether EBF is currently mispriced by the market.
Is Ennis Using Its Retained Earnings Effectively?
With a high three-year median payout ratio of 79% (implying that 21% of the profits are retained), most of Ennis' profits are being paid to shareholders, which explains the company's shrinking earnings. The business is only left with a small pool of capital to reinvest - A vicious cycle that doesn't benefit the company in the long-run.
Moreover, Ennis has been paying dividends for at least ten years or more suggesting that management must have perceived that the shareholders prefer dividends over earnings growth.
Conclusion
On the whole, we do feel that Ennis has some positive attributes. Although, we are disappointed to see a lack of growth in earnings even in spite of a high ROE. Bear in mind, the company reinvests a small portion of its profits, which means that investors aren't reaping the benefits of the high rate of return. Until now, we have only just grazed the surface of the company's past performance by looking at the company's fundamentals. To gain further insights into Ennis' past profit growth, check out this visualization of past earnings, revenue and cash flows.
Have feedback on this article? Concerned about the content? Get in touch with us directly. Alternatively, email editorial-team (at) simplywallst.com.
This article by Simply Wall St is general in nature. We provide commentary based on historical data and analyst forecasts only using an unbiased methodology and our articles are not intended to be financial advice. It does not constitute a recommendation to buy or sell any stock, and does not take account of your objectives, or your financial situation. We aim to bring you long-term focused analysis driven by fundamental data. Note that our analysis may not factor in the latest price-sensitive company announcements or qualitative material. Simply Wall St has no position in any stocks mentioned.
Join A Paid User Research Session
You’ll receive a US$30 Amazon Gift card for 1 hour of your time while helping us build better investing tools for the individual investors like yourself. Sign up here
