Has Ennis, Inc. (NYSE:EBF) Stock's Recent Performance Got Anything to Do With Its Financial Health?
Most readers would already know that Ennis' (NYSE:EBF) stock increased by 3.9% over the past three months. As most would know, long-term fundamentals have a strong correlation with market price movements, so we decided to look at the company's key financial indicators today to determine if they have any role to play in the recent price movement. Particularly, we will be paying attention to Ennis' ROE today.
Return on equity or ROE is a key measure used to assess how efficiently a company's management is utilizing the company's capital. In short, ROE shows the profit each dollar generates with respect to its shareholder investments.
Check out our latest analysis for Ennis
How To Calculate Return On Equity?
ROE can be calculated by using the formula:
Return on Equity = Net Profit (from continuing operations) ÷ Shareholders' Equity
So, based on the above formula, the ROE for Ennis is:
13% = US$46m ÷ US$343m (Based on the trailing twelve months to August 2023).
The 'return' is the yearly profit. That means that for every $1 worth of shareholders' equity, the company generated $0.13 in profit.
What Has ROE Got To Do With Earnings Growth?
Thus far, we have learned that ROE measures how efficiently a company is generating its profits. Depending on how much of these profits the company reinvests or "retains", and how effectively it does so, we are then able to assess a company’s earnings growth potential. Generally speaking, other things being equal, firms with a high return on equity and profit retention, have a higher growth rate than firms that don’t share these attributes.
Ennis' Earnings Growth And 13% ROE
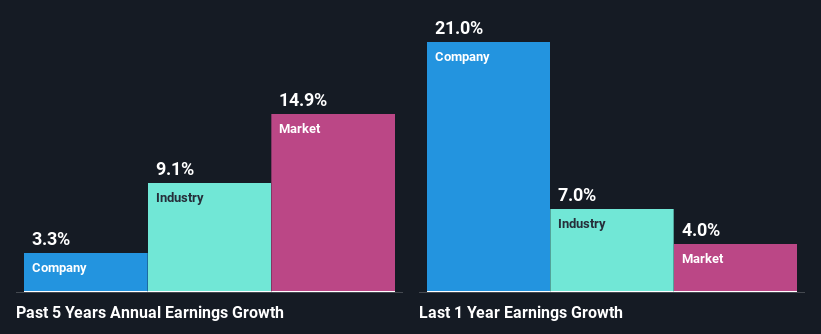
To begin with, Ennis seems to have a respectable ROE. Especially when compared to the industry average of 8.6% the company's ROE looks pretty impressive. Despite this, Ennis' five year net income growth was quite low averaging at only 3.3%. This is interesting as the high returns should mean that the company has the ability to generate high growth but for some reason, it hasn't been able to do so. We reckon that a low growth, when returns are quite high could be the result of certain circumstances like low earnings retention or poor allocation of capital.
As a next step, we compared Ennis' net income growth with the industry and were disappointed to see that the company's growth is lower than the industry average growth of 9.1% in the same period.
The basis for attaching value to a company is, to a great extent, tied to its earnings growth. What investors need to determine next is if the expected earnings growth, or the lack of it, is already built into the share price. Doing so will help them establish if the stock's future looks promising or ominous. One good indicator of expected earnings growth is the P/E ratio which determines the price the market is willing to pay for a stock based on its earnings prospects. So, you may want to check if Ennis is trading on a high P/E or a low P/E, relative to its industry.
Is Ennis Using Its Retained Earnings Effectively?
Ennis has a three-year median payout ratio of 79% (implying that it keeps only 21% of its profits), meaning that it pays out most of its profits to shareholders as dividends, and as a result, the company has seen low earnings growth.
In addition, Ennis has been paying dividends over a period of at least ten years suggesting that keeping up dividend payments is way more important to the management even if it comes at the cost of business growth.
Summary
Overall, we feel that Ennis certainly does have some positive factors to consider. However, while the company does have a high ROE, its earnings growth number is quite disappointing. This can be blamed on the fact that it reinvests only a small portion of its profits and pays out the rest as dividends.
Have feedback on this article? Concerned about the content? Get in touch with us directly. Alternatively, email editorial-team (at) simplywallst.com.
This article by Simply Wall St is general in nature. We provide commentary based on historical data and analyst forecasts only using an unbiased methodology and our articles are not intended to be financial advice. It does not constitute a recommendation to buy or sell any stock, and does not take account of your objectives, or your financial situation. We aim to bring you long-term focused analysis driven by fundamental data. Note that our analysis may not factor in the latest price-sensitive company announcements or qualitative material. Simply Wall St has no position in any stocks mentioned.
