Equal Sector Weight ETF EQL Hits $300 Million
This article was originally published on ETFTrends.com.
ETF milestones often focus on track records by themselves, but that can miss out on other key indicators. Ideally, investors and advisors would look for a strategy that combines outperformance with serious liquidity when perusing ETFs. In such an uncertain environment, factors like those offer strong starting points before digging into a given ETF. In this case, the equal sector weight ETF EQL, the ALPS Equal Sector Weight ETF, offers both.
EQL hit $300 million as of July 10, thanks to a $4.6 million increase in its AUM over the last five days. The ETF has benefitted mostly from price influence lately, but in the last year it has also welcomed notable fund flows. That AUM lifts it into the top six ETFs at SS&C ALPS ranked by AUM. The equal sector weight ETF has outperformed its ETF Database category average and its FactSet segment average, as well. It’s outperformed those metrics YTD, as well as over the last one, three, and five years, per VettaFi.
See more: “Eye Travel ETF JRNY’s Returns in Summer Swing”
How has EQL hit these milestones? The equal sector weight fund provides a relatively rare approach to its investors. The strategy targets domestic U.S. equities by weighting each sector equally. That offers a strong contrast to market cap-weighted ETFs like the SPDR S&P 500 Trust (SPY), for example.
EQL uses SPDR suite funds like the Industrial Select Sector SPDR Fund (XLI) to craft its equal-weight exposures. In total, it invests across 11 different sectors. That has helped it outperform SPY over three years, for example. That kind of diversification can help EQL continue to outperform if, say, the year's strong performance for big tech names inverts and strategies overweight on tech feel the pinch.
[caption id="attachment_526177" align="aligncenter" width="623"]
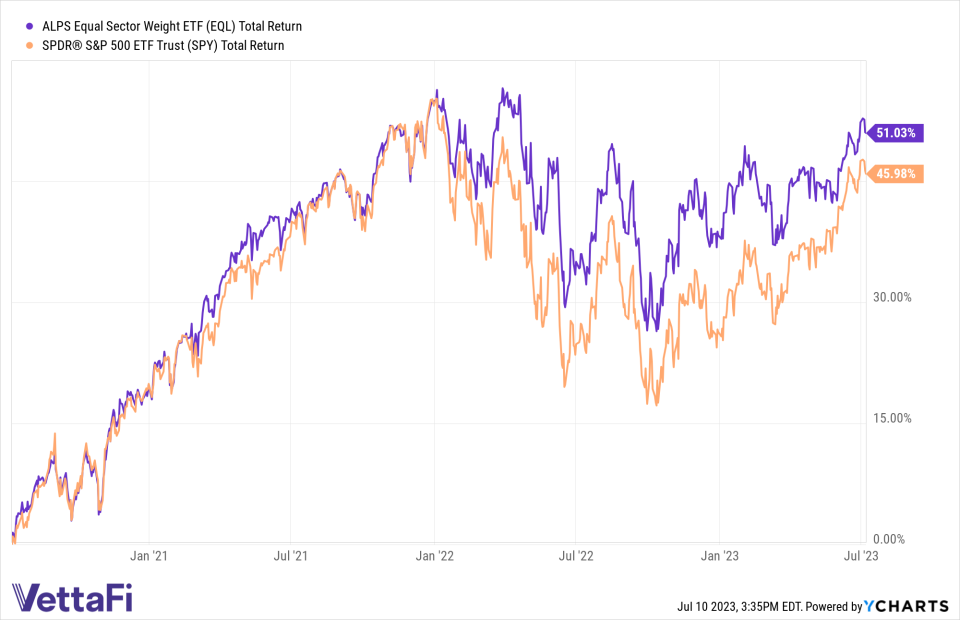
EQL has outperformed SPY over the last three years, per YCharts.[/caption]
EQL has also seen its price rise above both its 50-day and 200-day Simple Moving Averages (SMAs), per YCharts. That tech indicator provides one read on the amount of momentum behind a given strategy. In this case, with the 50-day SMA above its 200-day sibling, the newly $300 million ETF may be worth keeping an eye on.
For more news, information, and analysis, visit the ETF Building Blocks Channel.
POPULAR ARTICLES AND RESOURCES FROM ETFTRENDS.COM
