Is Erie Indemnity Company's (NASDAQ:ERIE) Recent Stock Performance Influenced By Its Fundamentals In Any Way?
Erie Indemnity (NASDAQ:ERIE) has had a great run on the share market with its stock up by a significant 13% over the last three months. Given that stock prices are usually aligned with a company's financial performance in the long-term, we decided to study its financial indicators more closely to see if they had a hand to play in the recent price move. In this article, we decided to focus on Erie Indemnity's ROE.
Return on equity or ROE is an important factor to be considered by a shareholder because it tells them how effectively their capital is being reinvested. In simpler terms, it measures the profitability of a company in relation to shareholder's equity.
See our latest analysis for Erie Indemnity
How Is ROE Calculated?
The formula for ROE is:
Return on Equity = Net Profit (from continuing operations) ÷ Shareholders' Equity
So, based on the above formula, the ROE for Erie Indemnity is:
25% = US$401m ÷ US$1.6b (Based on the trailing twelve months to September 2023).
The 'return' is the income the business earned over the last year. That means that for every $1 worth of shareholders' equity, the company generated $0.25 in profit.
What Has ROE Got To Do With Earnings Growth?
Thus far, we have learned that ROE measures how efficiently a company is generating its profits. We now need to evaluate how much profit the company reinvests or "retains" for future growth which then gives us an idea about the growth potential of the company. Assuming all else is equal, companies that have both a higher return on equity and higher profit retention are usually the ones that have a higher growth rate when compared to companies that don't have the same features.
Erie Indemnity's Earnings Growth And 25% ROE
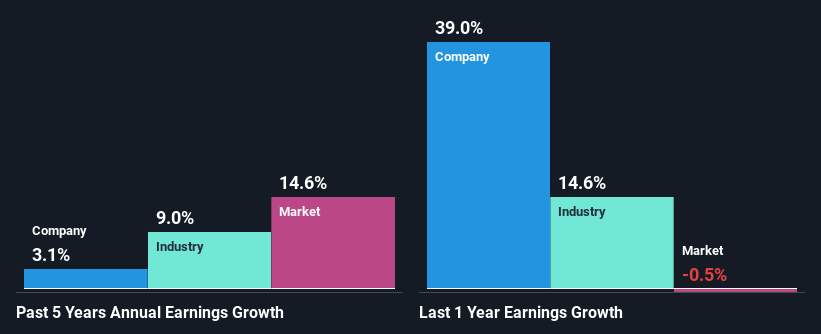
To begin with, Erie Indemnity has a pretty high ROE which is interesting. Additionally, the company's ROE is higher compared to the industry average of 14% which is quite remarkable. Despite this, Erie Indemnity's five year net income growth was quite low averaging at only 3.1%. That's a bit unexpected from a company which has such a high rate of return. We reckon that a low growth, when returns are quite high could be the result of certain circumstances like low earnings retention or or poor allocation of capital.
As a next step, we compared Erie Indemnity's net income growth with the industry and were disappointed to see that the company's growth is lower than the industry average growth of 9.0% in the same period.
Earnings growth is an important metric to consider when valuing a stock. The investor should try to establish if the expected growth or decline in earnings, whichever the case may be, is priced in. This then helps them determine if the stock is placed for a bright or bleak future. Is Erie Indemnity fairly valued compared to other companies? These 3 valuation measures might help you decide.
Is Erie Indemnity Using Its Retained Earnings Effectively?
Erie Indemnity has a three-year median payout ratio of 71% (implying that it keeps only 29% of its profits), meaning that it pays out most of its profits to shareholders as dividends, and as a result, the company has seen low earnings growth.
In addition, Erie Indemnity has been paying dividends over a period of at least ten years suggesting that keeping up dividend payments is way more important to the management even if it comes at the cost of business growth.
Conclusion
Overall, we feel that Erie Indemnity certainly does have some positive factors to consider. However, while the company does have a high ROE, its earnings growth number is quite disappointing. This can be blamed on the fact that it reinvests only a small portion of its profits and pays out the rest as dividends. Having said that, looking at the current analyst estimates, we found that the company's earnings are expected to gain momentum. To know more about the latest analysts predictions for the company, check out this visualization of analyst forecasts for the company.
Have feedback on this article? Concerned about the content? Get in touch with us directly. Alternatively, email editorial-team (at) simplywallst.com.
This article by Simply Wall St is general in nature. We provide commentary based on historical data and analyst forecasts only using an unbiased methodology and our articles are not intended to be financial advice. It does not constitute a recommendation to buy or sell any stock, and does not take account of your objectives, or your financial situation. We aim to bring you long-term focused analysis driven by fundamental data. Note that our analysis may not factor in the latest price-sensitive company announcements or qualitative material. Simply Wall St has no position in any stocks mentioned.
