Erie Indemnity Co's Dividend Analysis
Understanding the Dividend Dynamics of Erie Indemnity Co
Erie Indemnity Co (NASDAQ:ERIE) recently announced a dividend of $1.28 per share, payable on 2024-01-23, with the ex-dividend date set for 2024-01-05. As investors look forward to this upcoming payment, the spotlight also shines on the company's dividend history, yield, and growth rates. Using the data from GuruFocus, let's look into Erie Indemnity Co's dividend performance and assess its sustainability.
What Does Erie Indemnity Co Do?
This Powerful Chart Made Peter Lynch 29% A Year For 13 Years
How to calculate the intrinsic value of a stock?
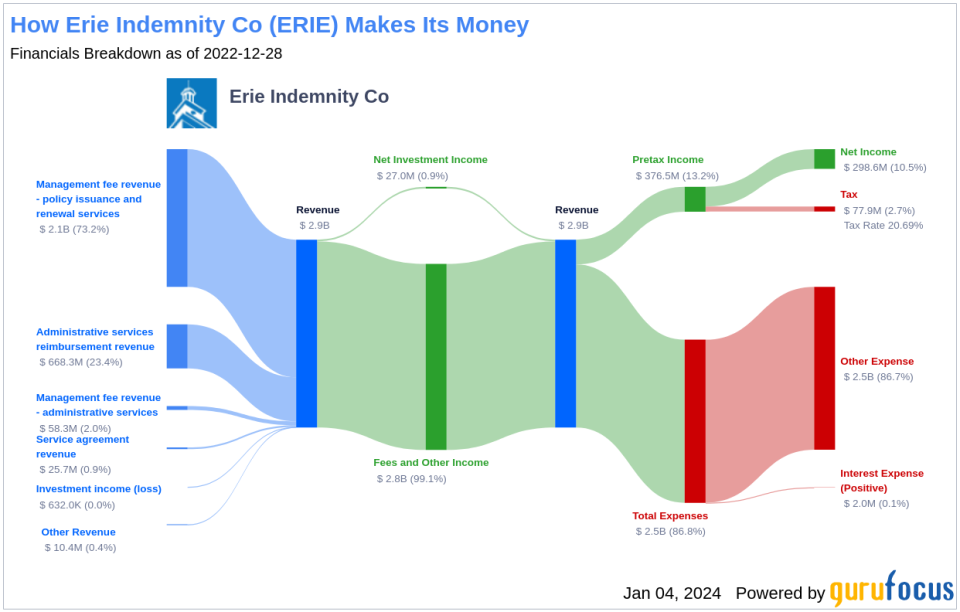
Erie Indemnity Co primarily performs services on behalf of the Erie Insurance Exchange relating to sales, underwriting, and issuance of policies. Erie Indemnity's results are tied to the performance of the Insurance Exchange, which principally provides automobile and homeowners insurance for individuals, along with multiperil, workers' compensation, and commercial automobile insurance for its commercial clients. Erie Indemnity's management fee is typically 25% of the Exchange's premiums, and this accounts for all of Erie Indemnity's revenue. The company operates exclusively in the United States.
A Glimpse at Erie Indemnity Co's Dividend History
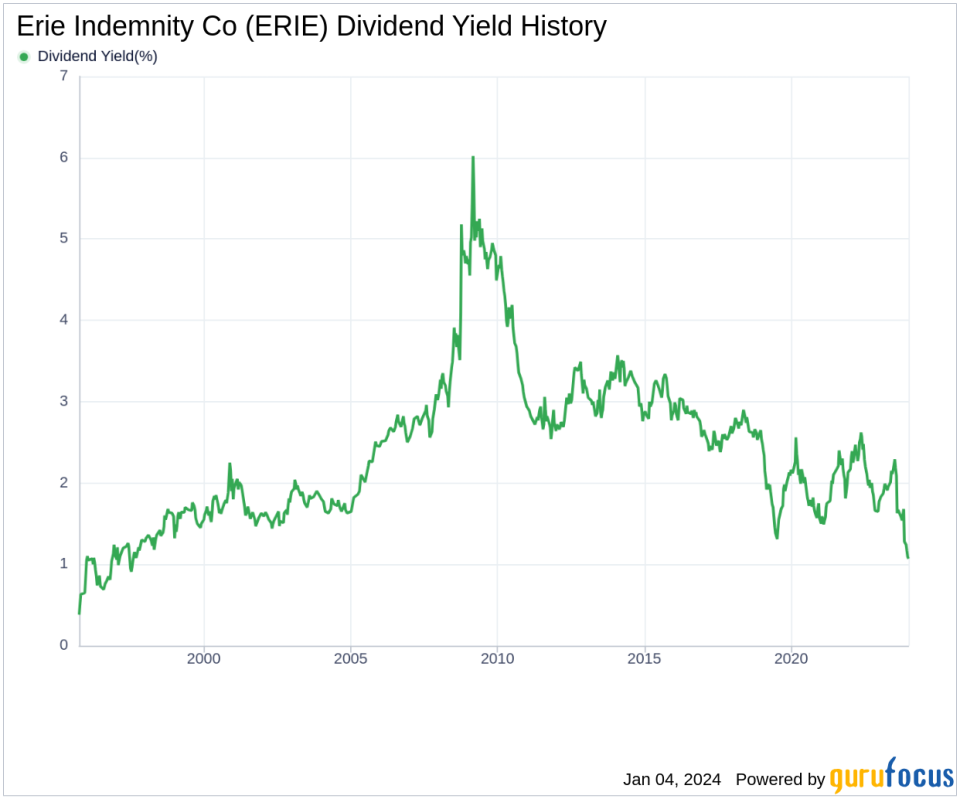
Erie Indemnity Co has maintained a consistent dividend payment record since 1995. Dividends are currently distributed on a quarterly basis. Erie Indemnity Co has increased its dividend each year since 1995. The stock is thus listed as a dividend aristocrat, an honor that is given to companies that have increased their dividend each year for at least the past 29 years. Below is a chart showing annual Dividends Per Share for tracking historical trends.
Breaking Down Erie Indemnity Co's Dividend Yield and Growth
As of today, Erie Indemnity Co currently has a 12-month trailing dividend yield of 1.06% and a 12-month forward dividend yield of 1.51%. This suggests an expectation of increased dividend payments over the next 12 months. However, Erie Indemnity Co's dividend yield of 1.06% is near a 10-year low and underperforms 88.24% of global competitors in the Insurance industry, suggesting that the company's dividend yield may not be a compelling proposition for income investors.
Over the past three years, Erie Indemnity Co's annual dividend growth rate was 7.20%. Extended to a five-year horizon, this rate stayed the same. And over the past decade, Erie Indemnity Co's annual dividends per share growth rate stands at 7.20%. Based on Erie Indemnity Co's dividend yield and five-year growth rate, the 5-year yield on cost of Erie Indemnity Co stock as of today is approximately 1.50%.
The Sustainability Question: Payout Ratio and Profitability
To assess the sustainability of the dividend, one needs to evaluate the company's payout ratio. The dividend payout ratio provides insights into the portion of earnings the company distributes as dividends. A lower ratio suggests that the company retains a significant part of its earnings, thereby ensuring the availability of funds for future growth and unexpected downturns. As of 2023-09-30, Erie Indemnity Co's dividend payout ratio is 0.47.
Erie Indemnity Co's profitability rank, offers an understanding of the company's earnings prowess relative to its peers. GuruFocus ranks Erie Indemnity Co's profitability 8 out of 10 as of 2023-09-30, suggesting good profitability prospects. The company has reported positive net income for each of year over the past decade, further solidifying its high profitability.
Growth Metrics: The Future Outlook
To ensure the sustainability of dividends, a company must have robust growth metrics. Erie Indemnity Co's growth rank of 8 out of 10 suggests that the company's growth trajectory is good relative to its competitors.
Revenue is the lifeblood of any company, and Erie Indemnity Co's revenue per share, combined with the 3-year revenue growth rate, indicates a strong revenue model. Erie Indemnity Co's revenue has increased by approximately 0.50% per year on average, a rate that underperforms approximately 66.22% of global competitors.
The company's 3-year EPS growth rate showcases its capability to grow its earnings, a critical component for sustaining dividends in the long run. During the past three years, Erie Indemnity Co's earnings increased by approximately -2.00% per year on average, a rate that underperforms approximately 59.24% of global competitors.
Lastly, the company's 5-year EBITDA growth rate of 6.20%, which underperforms approximately 47.75% of global competitors.
Next Steps
Considering Erie Indemnity Co's dividend payments, growth rate, payout ratio, profitability, and growth metrics, investors are presented with a nuanced picture. While the company boasts a reliable dividend aristocrat status, its current yield is relatively low in the insurance sector. However, a reasonable payout ratio paired with a strong profitability rank may reassure investors about the sustainability of dividends. Growth metrics present a mixed outlook, suggesting careful consideration of future revenue and earnings expansion. Value investors should weigh these factors against their investment strategy and risk appetite. For those seeking high-dividend yield opportunities, GuruFocus Premium users can screen for high-dividend yield stocks using the High Dividend Yield Screener.
This article, generated by GuruFocus, is designed to provide general insights and is not tailored financial advice. Our commentary is rooted in historical data and analyst projections, utilizing an impartial methodology, and is not intended to serve as specific investment guidance. It does not formulate a recommendation to purchase or divest any stock and does not consider individual investment objectives or financial circumstances. Our objective is to deliver long-term, fundamental data-driven analysis. Be aware that our analysis might not incorporate the most recent, price-sensitive company announcements or qualitative information. GuruFocus holds no position in the stocks mentioned herein.
This article first appeared on GuruFocus.
