Estimating The Fair Value Of Daily Journal Corporation (NASDAQ:DJCO)
Key Insights
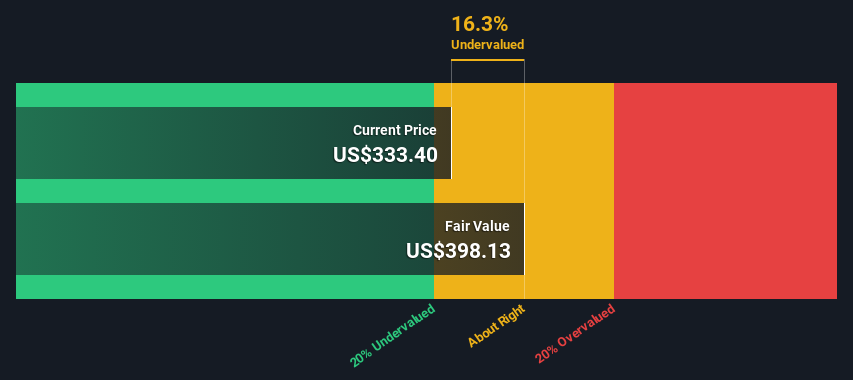
Daily Journal's estimated fair value is US$398 based on 2 Stage Free Cash Flow to Equity
Current share price of US$333 suggests Daily Journal is potentially trading close to its fair value
When compared to theindustry average discount to fair value of 25%, Daily Journal's competitors seem to be trading at a greater discount
In this article we are going to estimate the intrinsic value of Daily Journal Corporation (NASDAQ:DJCO) by taking the expected future cash flows and discounting them to today's value. We will use the Discounted Cash Flow (DCF) model on this occasion. It may sound complicated, but actually it is quite simple!
We generally believe that a company's value is the present value of all of the cash it will generate in the future. However, a DCF is just one valuation metric among many, and it is not without flaws. If you still have some burning questions about this type of valuation, take a look at the Simply Wall St analysis model.
See our latest analysis for Daily Journal
Step By Step Through The Calculation
We're using the 2-stage growth model, which simply means we take in account two stages of company's growth. In the initial period the company may have a higher growth rate and the second stage is usually assumed to have a stable growth rate. To start off with, we need to estimate the next ten years of cash flows. Seeing as no analyst estimates of free cash flow are available to us, we have extrapolate the previous free cash flow (FCF) from the company's last reported value. We assume companies with shrinking free cash flow will slow their rate of shrinkage, and that companies with growing free cash flow will see their growth rate slow, over this period. We do this to reflect that growth tends to slow more in the early years than it does in later years.
Generally we assume that a dollar today is more valuable than a dollar in the future, so we need to discount the sum of these future cash flows to arrive at a present value estimate:
10-year free cash flow (FCF) estimate
2024 | 2025 | 2026 | 2027 | 2028 | 2029 | 2030 | 2031 | 2032 | 2033 | |
Levered FCF ($, Millions) | US$14.5m | US$17.2m | US$19.6m | US$21.7m | US$23.4m | US$24.9m | US$26.2m | US$27.3m | US$28.3m | US$29.2m |
Growth Rate Estimate Source | Est @ 26.21% | Est @ 19.03% | Est @ 14.01% | Est @ 10.49% | Est @ 8.03% | Est @ 6.31% | Est @ 5.10% | Est @ 4.26% | Est @ 3.67% | Est @ 3.26% |
Present Value ($, Millions) Discounted @ 6.4% | US$13.6 | US$15.2 | US$16.3 | US$16.9 | US$17.2 | US$17.1 | US$16.9 | US$16.6 | US$16.1 | US$15.7 |
("Est" = FCF growth rate estimated by Simply Wall St)
Present Value of 10-year Cash Flow (PVCF) = US$162m
After calculating the present value of future cash flows in the initial 10-year period, we need to calculate the Terminal Value, which accounts for all future cash flows beyond the first stage. For a number of reasons a very conservative growth rate is used that cannot exceed that of a country's GDP growth. In this case we have used the 5-year average of the 10-year government bond yield (2.3%) to estimate future growth. In the same way as with the 10-year 'growth' period, we discount future cash flows to today's value, using a cost of equity of 6.4%.
Terminal Value (TV)= FCF2033 × (1 + g) ÷ (r – g) = US$29m× (1 + 2.3%) ÷ (6.4%– 2.3%) = US$721m
Present Value of Terminal Value (PVTV)= TV / (1 + r)10= US$721m÷ ( 1 + 6.4%)10= US$387m
The total value, or equity value, is then the sum of the present value of the future cash flows, which in this case is US$548m. To get the intrinsic value per share, we divide this by the total number of shares outstanding. Relative to the current share price of US$333, the company appears about fair value at a 16% discount to where the stock price trades currently. Valuations are imprecise instruments though, rather like a telescope - move a few degrees and end up in a different galaxy. Do keep this in mind.
The Assumptions
Now the most important inputs to a discounted cash flow are the discount rate, and of course, the actual cash flows. You don't have to agree with these inputs, I recommend redoing the calculations yourself and playing with them. The DCF also does not consider the possible cyclicality of an industry, or a company's future capital requirements, so it does not give a full picture of a company's potential performance. Given that we are looking at Daily Journal as potential shareholders, the cost of equity is used as the discount rate, rather than the cost of capital (or weighted average cost of capital, WACC) which accounts for debt. In this calculation we've used 6.4%, which is based on a levered beta of 0.901. Beta is a measure of a stock's volatility, compared to the market as a whole. We get our beta from the industry average beta of globally comparable companies, with an imposed limit between 0.8 and 2.0, which is a reasonable range for a stable business.
SWOT Analysis for Daily Journal
Strength
Debt is well covered by earnings.
Weakness
No major weaknesses identified for DJCO.
Opportunity
Current share price is below our estimate of fair value.
Lack of analyst coverage makes it difficult to determine DJCO's earnings prospects.
Threat
Debt is not well covered by operating cash flow.
Moving On:
Valuation is only one side of the coin in terms of building your investment thesis, and it is only one of many factors that you need to assess for a company. DCF models are not the be-all and end-all of investment valuation. Preferably you'd apply different cases and assumptions and see how they would impact the company's valuation. For example, changes in the company's cost of equity or the risk free rate can significantly impact the valuation. For Daily Journal, we've put together three fundamental items you should assess:
Risks: For example, we've discovered 1 warning sign for Daily Journal that you should be aware of before investing here.
Other Solid Businesses: Low debt, high returns on equity and good past performance are fundamental to a strong business. Why not explore our interactive list of stocks with solid business fundamentals to see if there are other companies you may not have considered!
Other Top Analyst Picks: Interested to see what the analysts are thinking? Take a look at our interactive list of analysts' top stock picks to find out what they feel might have an attractive future outlook!
PS. Simply Wall St updates its DCF calculation for every American stock every day, so if you want to find the intrinsic value of any other stock just search here.
Have feedback on this article? Concerned about the content? Get in touch with us directly. Alternatively, email editorial-team (at) simplywallst.com.
This article by Simply Wall St is general in nature. We provide commentary based on historical data and analyst forecasts only using an unbiased methodology and our articles are not intended to be financial advice. It does not constitute a recommendation to buy or sell any stock, and does not take account of your objectives, or your financial situation. We aim to bring you long-term focused analysis driven by fundamental data. Note that our analysis may not factor in the latest price-sensitive company announcements or qualitative material. Simply Wall St has no position in any stocks mentioned.
