Estimating The Fair Value Of NVE Corporation (NASDAQ:NVEC)
Key Insights
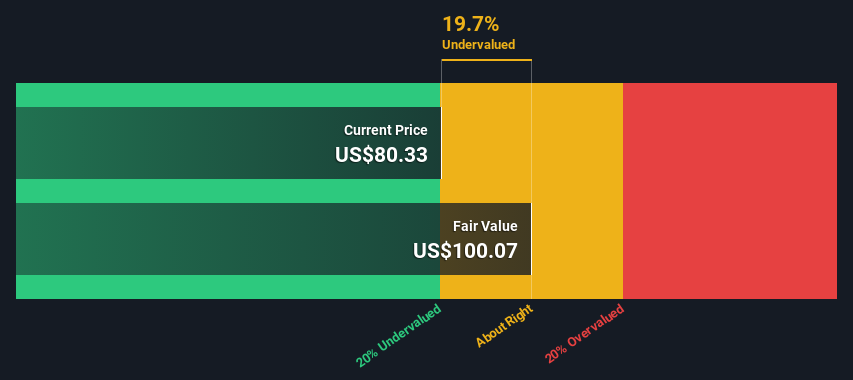
Using the 2 Stage Free Cash Flow to Equity, NVE fair value estimate is US$100
With US$80.33 share price, NVE appears to be trading close to its estimated fair value
Peers of NVE are currently trading on average at a 70% premium
Does the August share price for NVE Corporation (NASDAQ:NVEC) reflect what it's really worth? Today, we will estimate the stock's intrinsic value by taking the forecast future cash flows of the company and discounting them back to today's value. One way to achieve this is by employing the Discounted Cash Flow (DCF) model. There's really not all that much to it, even though it might appear quite complex.
Companies can be valued in a lot of ways, so we would point out that a DCF is not perfect for every situation. For those who are keen learners of equity analysis, the Simply Wall St analysis model here may be something of interest to you.
Check out our latest analysis for NVE
The Method
We're using the 2-stage growth model, which simply means we take in account two stages of company's growth. In the initial period the company may have a higher growth rate and the second stage is usually assumed to have a stable growth rate. To start off with, we need to estimate the next ten years of cash flows. Seeing as no analyst estimates of free cash flow are available to us, we have extrapolate the previous free cash flow (FCF) from the company's last reported value. We assume companies with shrinking free cash flow will slow their rate of shrinkage, and that companies with growing free cash flow will see their growth rate slow, over this period. We do this to reflect that growth tends to slow more in the early years than it does in later years.
A DCF is all about the idea that a dollar in the future is less valuable than a dollar today, so we discount the value of these future cash flows to their estimated value in today's dollars:
10-year free cash flow (FCF) estimate
2024 | 2025 | 2026 | 2027 | 2028 | 2029 | 2030 | 2031 | 2032 | 2033 | |
Levered FCF ($, Millions) | US$23.5m | US$26.5m | US$29.0m | US$31.1m | US$32.9m | US$34.4m | US$35.7m | US$36.9m | US$38.0m | US$39.1m |
Growth Rate Estimate Source | Est @ 16.95% | Est @ 12.51% | Est @ 9.40% | Est @ 7.23% | Est @ 5.70% | Est @ 4.64% | Est @ 3.89% | Est @ 3.37% | Est @ 3.00% | Est @ 2.75% |
Present Value ($, Millions) Discounted @ 8.5% | US$21.7 | US$22.5 | US$22.7 | US$22.4 | US$21.8 | US$21.0 | US$20.2 | US$19.2 | US$18.2 | US$17.3 |
("Est" = FCF growth rate estimated by Simply Wall St)
Present Value of 10-year Cash Flow (PVCF) = US$207m
The second stage is also known as Terminal Value, this is the business's cash flow after the first stage. For a number of reasons a very conservative growth rate is used that cannot exceed that of a country's GDP growth. In this case we have used the 5-year average of the 10-year government bond yield (2.2%) to estimate future growth. In the same way as with the 10-year 'growth' period, we discount future cash flows to today's value, using a cost of equity of 8.5%.
Terminal Value (TV)= FCF2033 × (1 + g) ÷ (r – g) = US$39m× (1 + 2.2%) ÷ (8.5%– 2.2%) = US$627m
Present Value of Terminal Value (PVTV)= TV / (1 + r)10= US$627m÷ ( 1 + 8.5%)10= US$277m
The total value, or equity value, is then the sum of the present value of the future cash flows, which in this case is US$484m. In the final step we divide the equity value by the number of shares outstanding. Relative to the current share price of US$80.3, the company appears about fair value at a 20% discount to where the stock price trades currently. The assumptions in any calculation have a big impact on the valuation, so it is better to view this as a rough estimate, not precise down to the last cent.
Important Assumptions
Now the most important inputs to a discounted cash flow are the discount rate, and of course, the actual cash flows. You don't have to agree with these inputs, I recommend redoing the calculations yourself and playing with them. The DCF also does not consider the possible cyclicality of an industry, or a company's future capital requirements, so it does not give a full picture of a company's potential performance. Given that we are looking at NVE as potential shareholders, the cost of equity is used as the discount rate, rather than the cost of capital (or weighted average cost of capital, WACC) which accounts for debt. In this calculation we've used 8.5%, which is based on a levered beta of 1.274. Beta is a measure of a stock's volatility, compared to the market as a whole. We get our beta from the industry average beta of globally comparable companies, with an imposed limit between 0.8 and 2.0, which is a reasonable range for a stable business.
SWOT Analysis for NVE
Strength
Earnings growth over the past year exceeded the industry.
Currently debt free.
Dividend is in the top 25% of dividend payers in the market.
Weakness
No major weaknesses identified for NVEC.
Opportunity
Current share price is below our estimate of fair value.
Lack of analyst coverage makes it difficult to determine NVEC's earnings prospects.
Threat
Dividends are not covered by cash flow.
Looking Ahead:
Whilst important, the DCF calculation shouldn't be the only metric you look at when researching a company. DCF models are not the be-all and end-all of investment valuation. Instead the best use for a DCF model is to test certain assumptions and theories to see if they would lead to the company being undervalued or overvalued. If a company grows at a different rate, or if its cost of equity or risk free rate changes sharply, the output can look very different. For NVE, we've compiled three important elements you should assess:
Risks: To that end, you should be aware of the 1 warning sign we've spotted with NVE .
Other High Quality Alternatives: Do you like a good all-rounder? Explore our interactive list of high quality stocks to get an idea of what else is out there you may be missing!
Other Environmentally-Friendly Companies: Concerned about the environment and think consumers will buy eco-friendly products more and more? Browse through our interactive list of companies that are thinking about a greener future to discover some stocks you may not have thought of!
PS. The Simply Wall St app conducts a discounted cash flow valuation for every stock on the NASDAQCM every day. If you want to find the calculation for other stocks just search here.
Have feedback on this article? Concerned about the content? Get in touch with us directly. Alternatively, email editorial-team (at) simplywallst.com.
This article by Simply Wall St is general in nature. We provide commentary based on historical data and analyst forecasts only using an unbiased methodology and our articles are not intended to be financial advice. It does not constitute a recommendation to buy or sell any stock, and does not take account of your objectives, or your financial situation. We aim to bring you long-term focused analysis driven by fundamental data. Note that our analysis may not factor in the latest price-sensitive company announcements or qualitative material. Simply Wall St has no position in any stocks mentioned.
