Estimating The Intrinsic Value Of Eastman Kodak Company (NYSE:KODK)
Key Insights
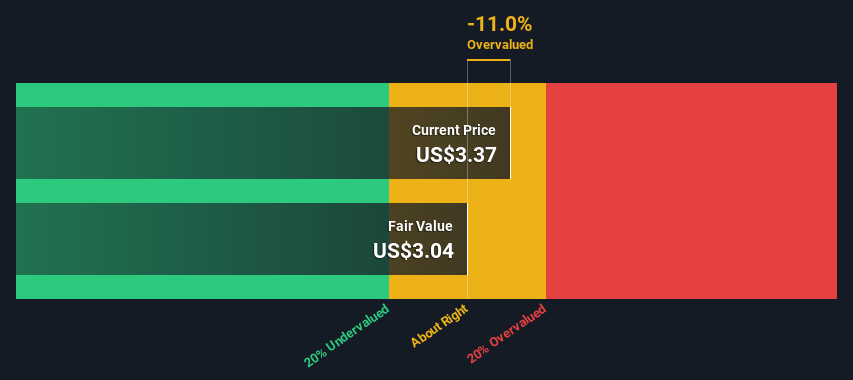
The projected fair value for Eastman Kodak is US$3.04 based on 2 Stage Free Cash Flow to Equity
Eastman Kodak's US$3.37 share price indicates it is trading at similar levels as its fair value estimate
Eastman Kodak's peers seem to be trading at a lower premium to fair value based onthe industry average of -7.8%
Today we will run through one way of estimating the intrinsic value of Eastman Kodak Company (NYSE:KODK) by projecting its future cash flows and then discounting them to today's value. The Discounted Cash Flow (DCF) model is the tool we will apply to do this. Before you think you won't be able to understand it, just read on! It's actually much less complex than you'd imagine.
Companies can be valued in a lot of ways, so we would point out that a DCF is not perfect for every situation. If you want to learn more about discounted cash flow, the rationale behind this calculation can be read in detail in the Simply Wall St analysis model.
Check out our latest analysis for Eastman Kodak
Crunching The Numbers
We're using the 2-stage growth model, which simply means we take in account two stages of company's growth. In the initial period the company may have a higher growth rate and the second stage is usually assumed to have a stable growth rate. In the first stage we need to estimate the cash flows to the business over the next ten years. Seeing as no analyst estimates of free cash flow are available to us, we have extrapolate the previous free cash flow (FCF) from the company's last reported value. We assume companies with shrinking free cash flow will slow their rate of shrinkage, and that companies with growing free cash flow will see their growth rate slow, over this period. We do this to reflect that growth tends to slow more in the early years than it does in later years.
Generally we assume that a dollar today is more valuable than a dollar in the future, so we discount the value of these future cash flows to their estimated value in today's dollars:
10-year free cash flow (FCF) estimate
2024 | 2025 | 2026 | 2027 | 2028 | 2029 | 2030 | 2031 | 2032 | 2033 | |
Levered FCF ($, Millions) | US$14.8m | US$17.6m | US$20.1m | US$22.3m | US$24.1m | US$25.6m | US$26.9m | US$28.1m | US$29.1m | US$30.0m |
Growth Rate Estimate Source | Est @ 26.49% | Est @ 19.23% | Est @ 14.15% | Est @ 10.59% | Est @ 8.10% | Est @ 6.36% | Est @ 5.14% | Est @ 4.28% | Est @ 3.69% | Est @ 3.27% |
Present Value ($, Millions) Discounted @ 11% | US$13.3 | US$14.2 | US$14.5 | US$14.4 | US$14.0 | US$13.3 | US$12.6 | US$11.8 | US$10.9 | US$10.1 |
("Est" = FCF growth rate estimated by Simply Wall St)
Present Value of 10-year Cash Flow (PVCF) = US$129m
After calculating the present value of future cash flows in the initial 10-year period, we need to calculate the Terminal Value, which accounts for all future cash flows beyond the first stage. For a number of reasons a very conservative growth rate is used that cannot exceed that of a country's GDP growth. In this case we have used the 5-year average of the 10-year government bond yield (2.3%) to estimate future growth. In the same way as with the 10-year 'growth' period, we discount future cash flows to today's value, using a cost of equity of 11%.
Terminal Value (TV)= FCF2033 × (1 + g) ÷ (r – g) = US$30m× (1 + 2.3%) ÷ (11%– 2.3%) = US$334m
Present Value of Terminal Value (PVTV)= TV / (1 + r)10= US$334m÷ ( 1 + 11%)10= US$113m
The total value is the sum of cash flows for the next ten years plus the discounted terminal value, which results in the Total Equity Value, which in this case is US$242m. The last step is to then divide the equity value by the number of shares outstanding. Relative to the current share price of US$3.4, the company appears around fair value at the time of writing. Valuations are imprecise instruments though, rather like a telescope - move a few degrees and end up in a different galaxy. Do keep this in mind.
The Assumptions
Now the most important inputs to a discounted cash flow are the discount rate, and of course, the actual cash flows. You don't have to agree with these inputs, I recommend redoing the calculations yourself and playing with them. The DCF also does not consider the possible cyclicality of an industry, or a company's future capital requirements, so it does not give a full picture of a company's potential performance. Given that we are looking at Eastman Kodak as potential shareholders, the cost of equity is used as the discount rate, rather than the cost of capital (or weighted average cost of capital, WACC) which accounts for debt. In this calculation we've used 11%, which is based on a levered beta of 2.000. Beta is a measure of a stock's volatility, compared to the market as a whole. We get our beta from the industry average beta of globally comparable companies, with an imposed limit between 0.8 and 2.0, which is a reasonable range for a stable business.
SWOT Analysis for Eastman Kodak
Strength
Debt is well covered by earnings.
Weakness
Current share price is above our estimate of fair value.
Opportunity
KODK's financial characteristics indicate limited near-term opportunities for shareholders.
Lack of analyst coverage makes it difficult to determine KODK's earnings prospects.
Threat
Debt is not well covered by operating cash flow.
Looking Ahead:
Valuation is only one side of the coin in terms of building your investment thesis, and it shouldn't be the only metric you look at when researching a company. The DCF model is not a perfect stock valuation tool. Rather it should be seen as a guide to "what assumptions need to be true for this stock to be under/overvalued?" For instance, if the terminal value growth rate is adjusted slightly, it can dramatically alter the overall result. For Eastman Kodak, we've put together three fundamental items you should assess:
Risks: Every company has them, and we've spotted 1 warning sign for Eastman Kodak you should know about.
Management:Have insiders been ramping up their shares to take advantage of the market's sentiment for KODK's future outlook? Check out our management and board analysis with insights on CEO compensation and governance factors.
Other High Quality Alternatives: Do you like a good all-rounder? Explore our interactive list of high quality stocks to get an idea of what else is out there you may be missing!
PS. The Simply Wall St app conducts a discounted cash flow valuation for every stock on the NYSE every day. If you want to find the calculation for other stocks just search here.
Have feedback on this article? Concerned about the content? Get in touch with us directly. Alternatively, email editorial-team (at) simplywallst.com.
This article by Simply Wall St is general in nature. We provide commentary based on historical data and analyst forecasts only using an unbiased methodology and our articles are not intended to be financial advice. It does not constitute a recommendation to buy or sell any stock, and does not take account of your objectives, or your financial situation. We aim to bring you long-term focused analysis driven by fundamental data. Note that our analysis may not factor in the latest price-sensitive company announcements or qualitative material. Simply Wall St has no position in any stocks mentioned.
