Estimating The Intrinsic Value Of Maverix Metals Inc. (TSE:MMX)
Today we'll do a simple run through of a valuation method used to estimate the attractiveness of Maverix Metals Inc. (TSE:MMX) as an investment opportunity by estimating the company's future cash flows and discounting them to their present value. We will take advantage of the Discounted Cash Flow (DCF) model for this purpose. Don't get put off by the jargon, the math behind it is actually quite straightforward.
Remember though, that there are many ways to estimate a company's value, and a DCF is just one method. Anyone interested in learning a bit more about intrinsic value should have a read of the Simply Wall St analysis model.
View our latest analysis for Maverix Metals
Crunching the numbers
We are going to use a two-stage DCF model, which, as the name states, takes into account two stages of growth. The first stage is generally a higher growth period which levels off heading towards the terminal value, captured in the second 'steady growth' period. To begin with, we have to get estimates of the next ten years of cash flows. Where possible we use analyst estimates, but when these aren't available we extrapolate the previous free cash flow (FCF) from the last estimate or reported value. We assume companies with shrinking free cash flow will slow their rate of shrinkage, and that companies with growing free cash flow will see their growth rate slow, over this period. We do this to reflect that growth tends to slow more in the early years than it does in later years.
Generally we assume that a dollar today is more valuable than a dollar in the future, and so the sum of these future cash flows is then discounted to today's value:
10-year free cash flow (FCF) forecast
2020 | 2021 | 2022 | 2023 | 2024 | 2025 | 2026 | 2027 | 2028 | 2029 | |
Levered FCF ($, Millions) | US$32.7m | US$28.3m | US$30.6m | US$34.0m | US$34.6m | US$35.3m | US$35.9m | US$36.5m | US$37.2m | US$37.8m |
Growth Rate Estimate Source | Analyst x4 | Analyst x4 | Analyst x3 | Analyst x2 | Est @ 1.89% | Est @ 1.82% | Est @ 1.77% | Est @ 1.74% | Est @ 1.72% | Est @ 1.7% |
Present Value ($, Millions) Discounted @ 7.5% | US$30.4 | US$24.5 | US$24.6 | US$25.4 | US$24.1 | US$22.8 | US$21.6 | US$20.4 | US$19.3 | US$18.3 |
("Est" = FCF growth rate estimated by Simply Wall St)
Present Value of 10-year Cash Flow (PVCF) = US$231m
After calculating the present value of future cash flows in the initial 10-year period, we need to calculate the Terminal Value, which accounts for all future cash flows beyond the first stage. The Gordon Growth formula is used to calculate Terminal Value at a future annual growth rate equal to the 5-year average of the 10-year government bond yield of 1.7%. We discount the terminal cash flows to today's value at a cost of equity of 7.5%.
Terminal Value (TV)= FCF2029 × (1 + g) ÷ (r – g) = US$38m× (1 + 1.7%) ÷ (7.5%– 1.7%) = US$652m
Present Value of Terminal Value (PVTV)= TV / (1 + r)10= US$652m÷ ( 1 + 7.5%)10= US$315m
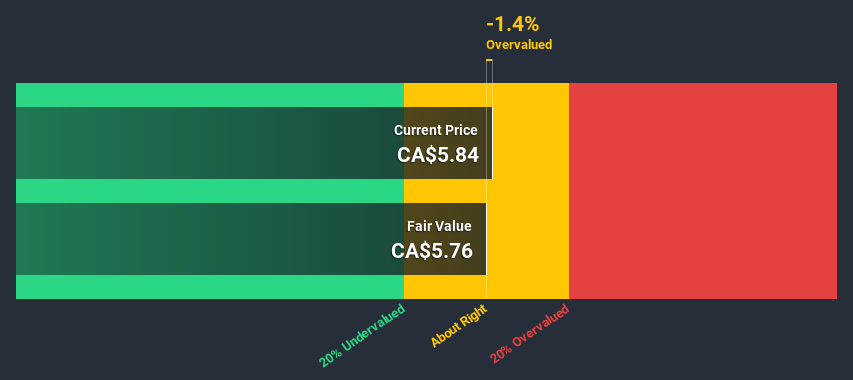
The total value is the sum of cash flows for the next ten years plus the discounted terminal value, which results in the Total Equity Value, which in this case is US$546m. To get the intrinsic value per share, we divide this by the total number of shares outstanding. Compared to the current share price of CA$5.8, the company appears around fair value at the time of writing. Valuations are imprecise instruments though, rather like a telescope - move a few degrees and end up in a different galaxy. Do keep this in mind.
The assumptions
The calculation above is very dependent on two assumptions. The first is the discount rate and the other is the cash flows. If you don't agree with these result, have a go at the calculation yourself and play with the assumptions. The DCF also does not consider the possible cyclicality of an industry, or a company's future capital requirements, so it does not give a full picture of a company's potential performance. Given that we are looking at Maverix Metals as potential shareholders, the cost of equity is used as the discount rate, rather than the cost of capital (or weighted average cost of capital, WACC) which accounts for debt. In this calculation we've used 7.5%, which is based on a levered beta of 0.980. Beta is a measure of a stock's volatility, compared to the market as a whole. We get our beta from the industry average beta of globally comparable companies, with an imposed limit between 0.8 and 2.0, which is a reasonable range for a stable business.
Moving On:
Although the valuation of a company is important, it ideally won't be the sole piece of analysis you scrutinize for a company. The DCF model is not a perfect stock valuation tool. Preferably you'd apply different cases and assumptions and see how they would impact the company's valuation. For example, changes in the company's cost of equity or the risk free rate can significantly impact the valuation. For Maverix Metals, there are three relevant aspects you should further examine:
Risks: For example, we've discovered 2 warning signs for Maverix Metals that you should be aware of before investing here.
Management:Have insiders been ramping up their shares to take advantage of the market's sentiment for MMX's future outlook? Check out our management and board analysis with insights on CEO compensation and governance factors.
Other Solid Businesses: Low debt, high returns on equity and good past performance are fundamental to a strong business. Why not explore our interactive list of stocks with solid business fundamentals to see if there are other companies you may not have considered!
PS. Simply Wall St updates its DCF calculation for every CA stock every day, so if you want to find the intrinsic value of any other stock just search here.
This article by Simply Wall St is general in nature. It does not constitute a recommendation to buy or sell any stock, and does not take account of your objectives, or your financial situation. We aim to bring you long-term focused analysis driven by fundamental data. Note that our analysis may not factor in the latest price-sensitive company announcements or qualitative material. Simply Wall St has no position in any stocks mentioned.
Have feedback on this article? Concerned about the content? Get in touch with us directly. Alternatively, email editorial-team@simplywallst.com.
