Estimating The Intrinsic Value Of REX American Resources Corporation (NYSE:REX)
Key Insights
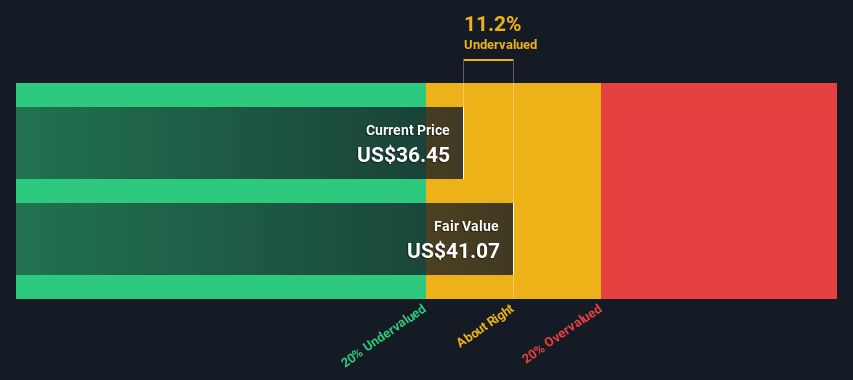
REX American Resources' estimated fair value is US$41.07 based on 2 Stage Free Cash Flow to Equity
Current share price of US$36.45 suggests REX American Resources is potentially trading close to its fair value
Today we'll do a simple run through of a valuation method used to estimate the attractiveness of REX American Resources Corporation (NYSE:REX) as an investment opportunity by taking the forecast future cash flows of the company and discounting them back to today's value. Our analysis will employ the Discounted Cash Flow (DCF) model. There's really not all that much to it, even though it might appear quite complex.
Remember though, that there are many ways to estimate a company's value, and a DCF is just one method. For those who are keen learners of equity analysis, the Simply Wall St analysis model here may be something of interest to you.
View our latest analysis for REX American Resources
The Calculation
We use what is known as a 2-stage model, which simply means we have two different periods of growth rates for the company's cash flows. Generally the first stage is higher growth, and the second stage is a lower growth phase. In the first stage we need to estimate the cash flows to the business over the next ten years. Seeing as no analyst estimates of free cash flow are available to us, we have extrapolate the previous free cash flow (FCF) from the company's last reported value. We assume companies with shrinking free cash flow will slow their rate of shrinkage, and that companies with growing free cash flow will see their growth rate slow, over this period. We do this to reflect that growth tends to slow more in the early years than it does in later years.
A DCF is all about the idea that a dollar in the future is less valuable than a dollar today, and so the sum of these future cash flows is then discounted to today's value:
10-year free cash flow (FCF) estimate
2024 | 2025 | 2026 | 2027 | 2028 | 2029 | 2030 | 2031 | 2032 | 2033 | |
Levered FCF ($, Millions) | US$49.9m | US$50.6m | US$51.4m | US$52.3m | US$53.3m | US$54.4m | US$55.4m | US$56.6m | US$57.7m | US$58.9m |
Growth Rate Estimate Source | Est @ 1.15% | Est @ 1.44% | Est @ 1.64% | Est @ 1.78% | Est @ 1.88% | Est @ 1.95% | Est @ 2.00% | Est @ 2.03% | Est @ 2.05% | Est @ 2.07% |
Present Value ($, Millions) Discounted @ 9.0% | US$45.8 | US$42.6 | US$39.7 | US$37.1 | US$34.7 | US$32.5 | US$30.4 | US$28.4 | US$26.6 | US$25.0 |
("Est" = FCF growth rate estimated by Simply Wall St)
Present Value of 10-year Cash Flow (PVCF) = US$343m
After calculating the present value of future cash flows in the initial 10-year period, we need to calculate the Terminal Value, which accounts for all future cash flows beyond the first stage. The Gordon Growth formula is used to calculate Terminal Value at a future annual growth rate equal to the 5-year average of the 10-year government bond yield of 2.1%. We discount the terminal cash flows to today's value at a cost of equity of 9.0%.
Terminal Value (TV)= FCF2033 × (1 + g) ÷ (r – g) = US$59m× (1 + 2.1%) ÷ (9.0%– 2.1%) = US$877m
Present Value of Terminal Value (PVTV)= TV / (1 + r)10= US$877m÷ ( 1 + 9.0%)10= US$371m
The total value, or equity value, is then the sum of the present value of the future cash flows, which in this case is US$714m. The last step is to then divide the equity value by the number of shares outstanding. Relative to the current share price of US$36.5, the company appears about fair value at a 11% discount to where the stock price trades currently. Remember though, that this is just an approximate valuation, and like any complex formula - garbage in, garbage out.
Important Assumptions
Now the most important inputs to a discounted cash flow are the discount rate, and of course, the actual cash flows. You don't have to agree with these inputs, I recommend redoing the calculations yourself and playing with them. The DCF also does not consider the possible cyclicality of an industry, or a company's future capital requirements, so it does not give a full picture of a company's potential performance. Given that we are looking at REX American Resources as potential shareholders, the cost of equity is used as the discount rate, rather than the cost of capital (or weighted average cost of capital, WACC) which accounts for debt. In this calculation we've used 9.0%, which is based on a levered beta of 1.155. Beta is a measure of a stock's volatility, compared to the market as a whole. We get our beta from the industry average beta of globally comparable companies, with an imposed limit between 0.8 and 2.0, which is a reasonable range for a stable business.
SWOT Analysis for REX American Resources
Strength
Currently debt free.
Weakness
Earnings declined over the past year.
Opportunity
Annual earnings are forecast to grow faster than the American market.
Current share price is below our estimate of fair value.
Threat
No apparent threats visible for REX.
Looking Ahead:
Valuation is only one side of the coin in terms of building your investment thesis, and it is only one of many factors that you need to assess for a company. The DCF model is not a perfect stock valuation tool. Instead the best use for a DCF model is to test certain assumptions and theories to see if they would lead to the company being undervalued or overvalued. For instance, if the terminal value growth rate is adjusted slightly, it can dramatically alter the overall result. For REX American Resources, there are three essential aspects you should explore:
Risks: Every company has them, and we've spotted 2 warning signs for REX American Resources you should know about.
Management:Have insiders been ramping up their shares to take advantage of the market's sentiment for REX's future outlook? Check out our management and board analysis with insights on CEO compensation and governance factors.
Other High Quality Alternatives: Do you like a good all-rounder? Explore our interactive list of high quality stocks to get an idea of what else is out there you may be missing!
PS. Simply Wall St updates its DCF calculation for every American stock every day, so if you want to find the intrinsic value of any other stock just search here.
Have feedback on this article? Concerned about the content? Get in touch with us directly. Alternatively, email editorial-team (at) simplywallst.com.
This article by Simply Wall St is general in nature. We provide commentary based on historical data and analyst forecasts only using an unbiased methodology and our articles are not intended to be financial advice. It does not constitute a recommendation to buy or sell any stock, and does not take account of your objectives, or your financial situation. We aim to bring you long-term focused analysis driven by fundamental data. Note that our analysis may not factor in the latest price-sensitive company announcements or qualitative material. Simply Wall St has no position in any stocks mentioned.
Join A Paid User Research Session
You’ll receive a US$30 Amazon Gift card for 1 hour of your time while helping us build better investing tools for the individual investors like yourself. Sign up here
