Estimating The Intrinsic Value Of Vector Group Ltd. (NYSE:VGR)
Key Insights
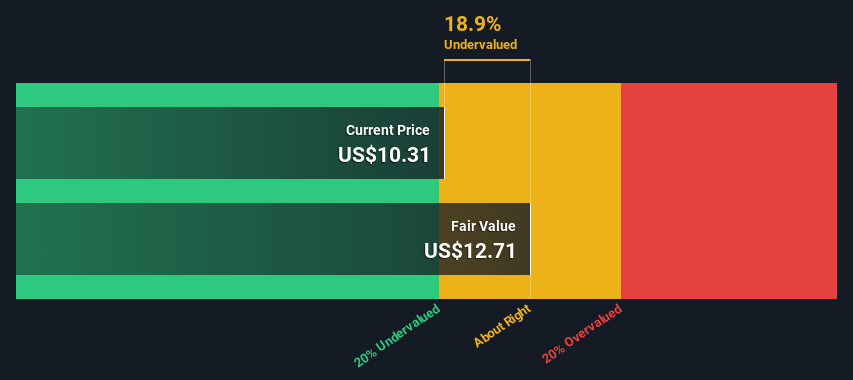
Vector Group's estimated fair value is US$12.71 based on 2 Stage Free Cash Flow to Equity
Current share price of US$10.31 suggests Vector Group is potentially trading close to its fair value
In this article we are going to estimate the intrinsic value of Vector Group Ltd. (NYSE:VGR) by taking the expected future cash flows and discounting them to today's value. The Discounted Cash Flow (DCF) model is the tool we will apply to do this. There's really not all that much to it, even though it might appear quite complex.
Remember though, that there are many ways to estimate a company's value, and a DCF is just one method. For those who are keen learners of equity analysis, the Simply Wall St analysis model here may be something of interest to you.
See our latest analysis for Vector Group
Crunching The Numbers
We're using the 2-stage growth model, which simply means we take in account two stages of company's growth. In the initial period the company may have a higher growth rate and the second stage is usually assumed to have a stable growth rate. In the first stage we need to estimate the cash flows to the business over the next ten years. Seeing as no analyst estimates of free cash flow are available to us, we have extrapolate the previous free cash flow (FCF) from the company's last reported value. We assume companies with shrinking free cash flow will slow their rate of shrinkage, and that companies with growing free cash flow will see their growth rate slow, over this period. We do this to reflect that growth tends to slow more in the early years than it does in later years.
A DCF is all about the idea that a dollar in the future is less valuable than a dollar today, so we need to discount the sum of these future cash flows to arrive at a present value estimate:
10-year free cash flow (FCF) forecast
2024 | 2025 | 2026 | 2027 | 2028 | 2029 | 2030 | 2031 | 2032 | 2033 | |
Levered FCF ($, Millions) | US$153.6m | US$142.0m | US$135.4m | US$131.9m | US$130.4m | US$130.3m | US$131.0m | US$132.4m | US$134.3m | US$136.5m |
Growth Rate Estimate Source | Est @ -11.76% | Est @ -7.56% | Est @ -4.63% | Est @ -2.57% | Est @ -1.14% | Est @ -0.13% | Est @ 0.58% | Est @ 1.07% | Est @ 1.41% | Est @ 1.66% |
Present Value ($, Millions) Discounted @ 8.2% | US$142 | US$121 | US$107 | US$96.4 | US$88.1 | US$81.3 | US$75.6 | US$70.7 | US$66.3 | US$62.3 |
("Est" = FCF growth rate estimated by Simply Wall St)
Present Value of 10-year Cash Flow (PVCF) = US$911m
We now need to calculate the Terminal Value, which accounts for all the future cash flows after this ten year period. The Gordon Growth formula is used to calculate Terminal Value at a future annual growth rate equal to the 5-year average of the 10-year government bond yield of 2.2%. We discount the terminal cash flows to today's value at a cost of equity of 8.2%.
Terminal Value (TV)= FCF2033 × (1 + g) ÷ (r – g) = US$137m× (1 + 2.2%) ÷ (8.2%– 2.2%) = US$2.3b
Present Value of Terminal Value (PVTV)= TV / (1 + r)10= US$2.3b÷ ( 1 + 8.2%)10= US$1.1b
The total value, or equity value, is then the sum of the present value of the future cash flows, which in this case is US$2.0b. To get the intrinsic value per share, we divide this by the total number of shares outstanding. Compared to the current share price of US$10.3, the company appears about fair value at a 19% discount to where the stock price trades currently. The assumptions in any calculation have a big impact on the valuation, so it is better to view this as a rough estimate, not precise down to the last cent.
The Assumptions
The calculation above is very dependent on two assumptions. The first is the discount rate and the other is the cash flows. Part of investing is coming up with your own evaluation of a company's future performance, so try the calculation yourself and check your own assumptions. The DCF also does not consider the possible cyclicality of an industry, or a company's future capital requirements, so it does not give a full picture of a company's potential performance. Given that we are looking at Vector Group as potential shareholders, the cost of equity is used as the discount rate, rather than the cost of capital (or weighted average cost of capital, WACC) which accounts for debt. In this calculation we've used 8.2%, which is based on a levered beta of 1.189. Beta is a measure of a stock's volatility, compared to the market as a whole. We get our beta from the industry average beta of globally comparable companies, with an imposed limit between 0.8 and 2.0, which is a reasonable range for a stable business.
SWOT Analysis for Vector Group
Strength
Earnings growth over the past year exceeded the industry.
Debt is well covered by earnings.
Dividends are covered by earnings and cash flows.
Dividend is in the top 25% of dividend payers in the market.
Weakness
No major weaknesses identified for VGR.
Opportunity
Annual revenue is forecast to grow faster than the American market.
Current share price is below our estimate of fair value.
Threat
Debt is not well covered by operating cash flow.
Total liabilities exceed total assets, which raises the risk of financial distress.
Looking Ahead:
Whilst important, the DCF calculation is only one of many factors that you need to assess for a company. It's not possible to obtain a foolproof valuation with a DCF model. Instead the best use for a DCF model is to test certain assumptions and theories to see if they would lead to the company being undervalued or overvalued. For example, changes in the company's cost of equity or the risk free rate can significantly impact the valuation. For Vector Group, we've compiled three fundamental elements you should further examine:
Risks: We feel that you should assess the 4 warning signs for Vector Group (2 make us uncomfortable!) we've flagged before making an investment in the company.
Management:Have insiders been ramping up their shares to take advantage of the market's sentiment for VGR's future outlook? Check out our management and board analysis with insights on CEO compensation and governance factors.
Other High Quality Alternatives: Do you like a good all-rounder? Explore our interactive list of high quality stocks to get an idea of what else is out there you may be missing!
PS. The Simply Wall St app conducts a discounted cash flow valuation for every stock on the NYSE every day. If you want to find the calculation for other stocks just search here.
Have feedback on this article? Concerned about the content? Get in touch with us directly. Alternatively, email editorial-team (at) simplywallst.com.
This article by Simply Wall St is general in nature. We provide commentary based on historical data and analyst forecasts only using an unbiased methodology and our articles are not intended to be financial advice. It does not constitute a recommendation to buy or sell any stock, and does not take account of your objectives, or your financial situation. We aim to bring you long-term focused analysis driven by fundamental data. Note that our analysis may not factor in the latest price-sensitive company announcements or qualitative material. Simply Wall St has no position in any stocks mentioned.
