ETF Scorecard: Annual Review of Commodities
This is a special edition of the ETFdb.com scorecard that delves into the annual performance of major commodities. The performance is measured from January 1, 2018 to November 30, 2018.
Most commodities have experienced carnage this year, with strong bouts of volatility. Natural gas and oil prices were particularly volatile, although the performance of the fuel commodities diverged dramatically. Silver and gold were hit by a strong bull market and rising Treasury yields. Agricultural commodities were mostly down.
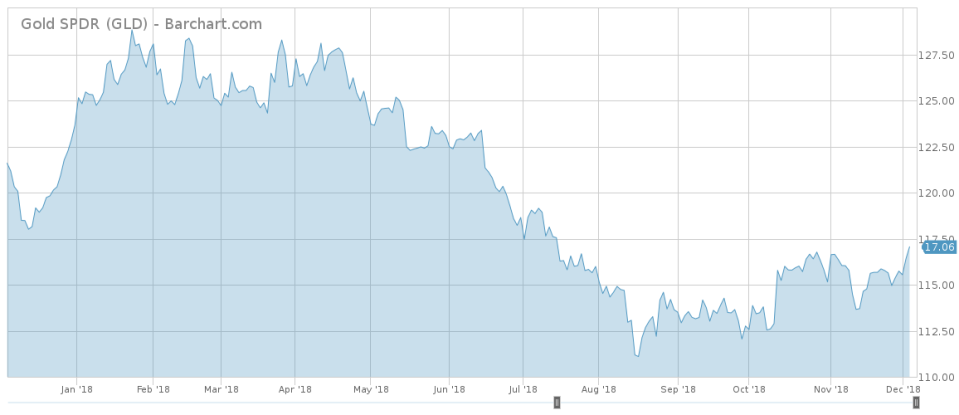
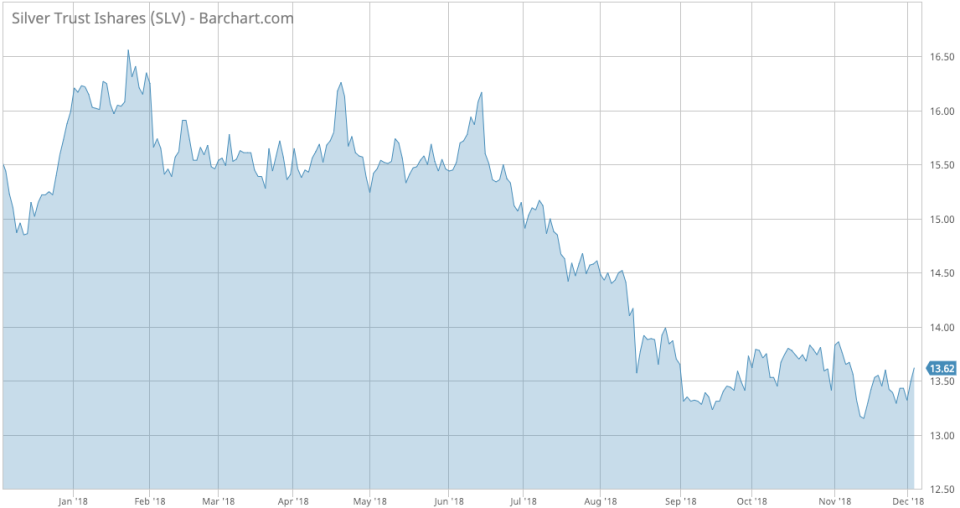
Gold and Silver
Gold (GLD A-) and silver (SLV C+) prices have both declined since the beginning of the year, as demand for safe-haven assets has been rather subdued. Indeed, as Treasury yields slowly crept up this year, holding precious metals has been a bad trade given their lack of returns. GLD has declined 7.32%, while SL shed 17.42%. Silver, which has extensive industrial uses, including medicine, electronics and jewelry, has been hit by the deteriorating trade relations between the U.S. and China and broad trade uncertainties. As hope emerges that the world’s two biggest economies will ink a trade agreement, silver may very well recover. For gold, however, which rises when the broad economy underperforms, may rally again if a recession hits.
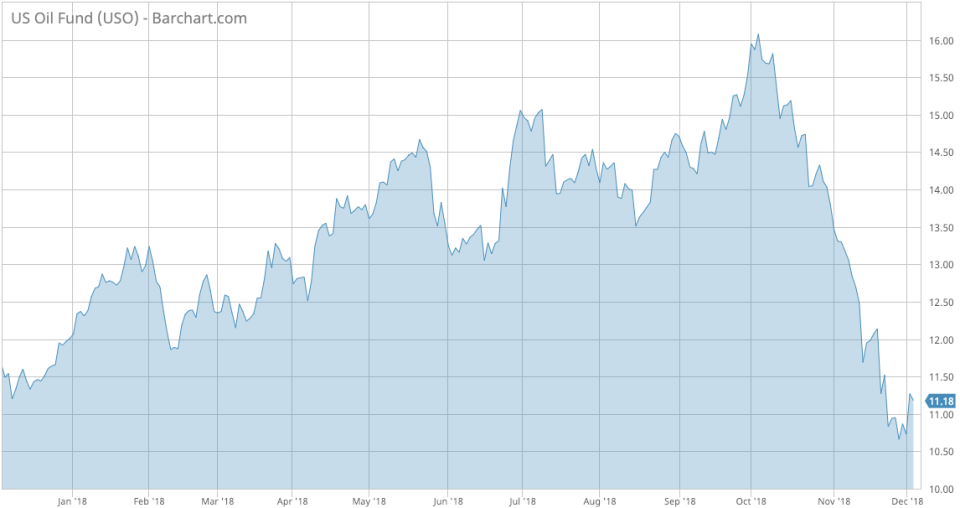
Oil
Oil prices (USO A) were staged for a strong year as recently as October, but a perfect storm of bad news took a toll on the commodity. For the better part of 2018, oil rallied on strong demand across the globe, limited supply thanks to the deal between the OPEC and Russia, and the U.S. sanctions against Iran.
At their peak in early October, crude was up as much as 30% for the year, but declined rapidly over the following two months and is now down more than 10%. Incessantly increasing stockpiles in the U.S. coupled with falling demand and high shale output have put pressure on oil. Small wonder that OPEC is organizing a meeting in Vienna to reduce oil production by potentially 1.3 million barrels per day. Russia is expected to join the cartel and is reportedly holding discussions on the amount of the expected cuts. In a further potential boost, Canada is expected to implement a mandated reduction in supply.
The big question hanging over oil remains the U.S. shale output. American producers have improved efficiency and may very well be calling the shots.
Natural Gas
Natural gas (UNG B-) has been relatively quiet for the better part of 2018, but the recent months have been extremely volatile. (UNG B-) is up as much as 54.4% since the start of the year, with most of the gains taking hold in November amid wild fluctuations. Investors are afraid that a cold winter will deplete the already low stockpiles, putting in danger the ability of shale gas producers to provide enough supply for U.S. markets. Inventories are at a 10-year low, while prices are hovering around two-year highs.
Sign up for ETFdb.com Pro and get access to real-time ratings on over 1,900 U.S.-listed ETFs.

Agricultural Commodities
Agricultural commodities also had a bad 2018, with Invesco’s ETF (DBA A) dropping nearly 8% year-to-date. Soybeans, cocoa and coffee make up nearly 40% of the ETF. Cocoa is up nearly 12% year-to-date, as strong demand in Asian countries and stable demand drove prices upward. Coffee, meanwhile, lost as much as 18% in the past year, as plentiful global supplies outstripped robust demand. U.S. soybeans had been hit by sanctions from China as a result of the trade war between the two countries, but hopes are high that a potential agreement will lift the 25% levy on U.S. soybean imports.
For more ETF news and analysis, subscribe to our free newsletter.

The Bottom Line
Natural gas was quiet for most of the year but surged in the past two months due to dwindling stockpiles and expectations of a cold winter in the U.S. The opposite happened with oil prices. Crude advanced slowly between the start of the year and October but fell abruptly on demand concerns. Gold and silver are in the red for the year, as rising Treasury yields and a strong economy diminished their safe-haven appeal.
Be sure to check our News section for the latest updates.
