ETF Scorecard: October 12 Edition
To help investors keep up with the markets, we present our ETF Scorecard. The Scorecard takes a step back and looks at how various asset classes across the globe are performing. The weekly performance is from last Friday’s open to this week’s Thursday close.
The global stock markets are selling off, with analysts blaming rising Treasury yields and interest rates. President Donald Trump said the Federal Reserve was culpable for the sell-off, going as far as to call the Fed policymakers “crazy.” The ten-year Treasury yields have been rising incessantly since the beginning of the month, from 3.08% on October 1 to as much as 3.23% on October 5. Now, the yields have given up some ground and sport a yield of 3.18%. The U.S. unemployment rate dropped from 3.9% to 3.7% in September, hitting the lowest level since December 1969. However, non-farm payrolls rose just by 134,000, below expectations of 185,000. For the prior month, the number of payrolls was revised up to 270,000. Average hourly earnings increased 2.8% from the same period last year, in line with estimates. U.K. manufacturing production contracted by 0.2% in August versus growth of 0.1% expected by pundits, in a further deterioration of the picture. Year-over-year, production grew by 1.3%, above forecasts of 1.1%. As the sell-off in equity markets deepens as a result of rising rates, inflation is stagnating, giving the Fed reasons to be optimistic the rout is temporary. The Consumer Price Index (CPI) rose 0.1% in September compared to 0.2% expected. The CPI is up 2.3% year-over-year, down from 2.7% in August. Core inflation increased 2.2% in September. U.S. unemployment claims came in at 214,000 for the week ended October 6, 7,000 more than expected by analysts. Still, claims are hovering around historic lows. Crude oil inventories advanced for the third consecutive week in the U.S. After gaining 8 million barrels in the prior week, stockpiles advanced 6 million for the seven-day period ended October 5.
Risk Appetite Review
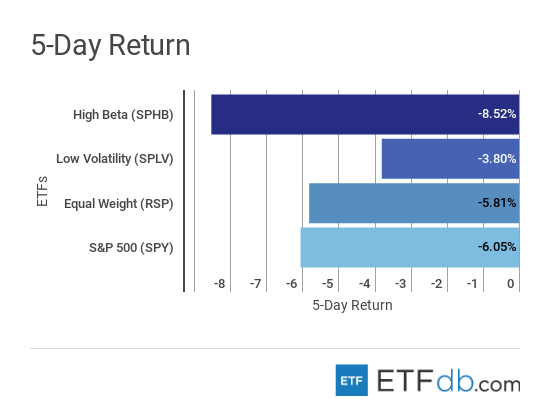
Markets sold off this week. Risk assets (SPHB B-) posted the worst performance, tumbling more than 8%. Low volatility (SPLV A) were the best performers, with a drop of 3.8%. The broad market (SPY A) lost as much as 6%. Sign up for ETFdb.com Pro and get access to real-time ratings on over 1,900 U.S.-listed ETFs.
Major Index Review
Major indexes were all down. Technology equities (QQQ A-) suffered the most from the negative sentiment toward equities, declining a little over 7%. The European and Australasian equities (EFA A) fell just 4.55%, as the sell-off was an exogenous event. (EFA A) is also the best performer for the rolling month, down just 2.87%. Russell 2000, the small-cap index, (IWM B+) plunged nearly 10% for the rolling month, representing the worst performance. To see how these indices performed a week before last, check out ETF Scorecard: October 5 Edition.

Sectors Review
The telecom sector (XTL A) suffered the most pain, losing more than 8% for the past five days and nearly 10% for the rolling month. Given the sell-off, investors were put off by telecom companies’ high indebtedness and the upcoming capital expenditures for the 5G spectrum. Utilities (XLU A), acting as a safe haven, were the only gainers from the pack this week, up 0.51%. Thanks to gains registered in previous weeks, the energy sector (XLE A) is up slightly for the rolling month and is the best performer. Use our Head-to-Head Comparison tool to compare two ETFs such as (XTL A) and (XLE A) on a variety of criteria such as performance, AUM, trading volume and expenses.

Foreign Equity Review
Brazil (EWZ B+) is again the best performer this week as it was largely insulated from the global sell-off. Investors cheered the results of the presidential elections. Far-right candidate Jair Bolsonaro is poised to win the presidency, and the market appreciated his move to appoint a respected financier to develop his economic policy. Brazil is also the best performer for the rolling month, up as much as 20.49%. Germany (EWG B+) is the worst performer this week, as the Eurozone is facing an internal crisis after Italy signaled it would not obey budget rules. (EWG B+) dropped 4.92%. India (EPI B+) is the worst monthly performer with a drop of 13.45%. To find out more about ETFs exposed to particular countries, use our ETF Country Exposure Tool. Select a particular country from a world map and get a list of all ETFs tracking your pick.

Commodities Review
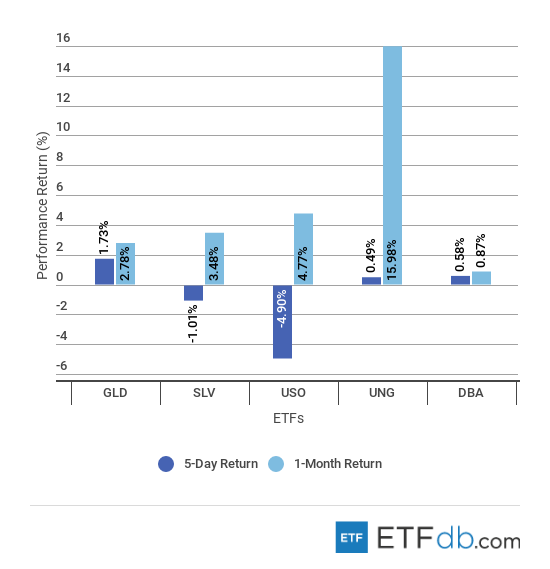
Commodities were mixed. Unsurprisingly, gold (GLD A-) was the best performer with a rise of 1.73%, as investors flew to safe-haven assets. Meanwhile, oil (USO A) dropped as much as 5% this week, due to faltering demand in the U.S. and rising inventory levels. For the rolling month, the Agricultural fund (DBA A) recorded the weakest performance, rising just 0.87%. Natural gas (UNG B-) remains the best performer for the past 30 days by far, up nearly 16%.
Currency Review
The U.S. dollar (UUP A) was the single faller this week, despite rising Treasury yields, which typically attract foreign investors to dollar-denominated assets. The Japanese yen (FXY C+), meanwhile, benefited from its safe-haven status, surging 1.63% for the week. However, that was not enough to bring the yen’s monthly performance into positive territory. The yen is the only faller for the past 30 days, down 0.61%. Emerging market currencies (CEW A) are up 2.38% for the rolling month, partly bolstered by the strong performance of the Brazilian real. For more ETF news and analysis, subscribe to our free newsletter.

Disclosure: No positions at time of writing.
