EUR/USD Mid-Session Technical Analysis for August 17, 2021
The Euro is trading sharply lower against the U.S. Dollar at the mid-session for a second straight day on Tuesday. Safe-haven buying of the greenback appears to be the reason for the weakness in the single-currency.
Tensions are being fueled by the situation in Afghanistan, China’s plans to regulate the internet sector, and the Delta variant COVID-19 surge which as forced some lockdowns.
At 15:02 GMT, the EUR/USD is trading 1.1716, down 0.0060 or -0.51%.
In U.S. economic news, a much sharper decline than expected in Tuesday’s U.S. retail sales curbed some of the gains in the dollar, but that was offset by the higher-than-forecast rise in industrial production. The news may have added to the uncertainty over whether the Fed will announce the start of tapering at next weekend’s central bankers’ meeting at Jackson Hole, or the next Fed meeting on September 21-22.
Daily Swing Chart Technical Analysis
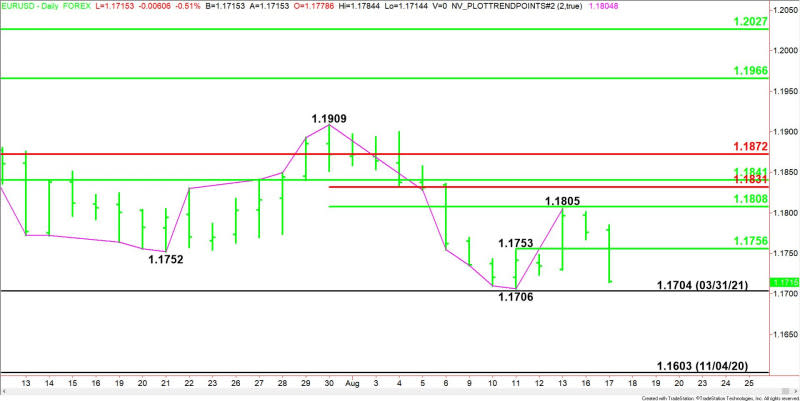
The main trend is down according to the daily swing chart. A trade through 1.1706 will reaffirm the downtrend. A move through 1.1909 will change the main trend to up.
Taking out 1.1706 will also turn 1.1805 into a new main top.
The minor range is 1.1706 to 1.1805. The market is currently trading on the weak side of its pivot at 1.1756, making it resistance.
The short-term range is 1.1909 to 1.1706. Its retracement zone at 1.1808 to 1.1831 is resistance.
Daily Swing Chart Technical Forecast
The direction of the EUR/USD into the close on Tuesday will be determined by trader reaction to 1.1756.
Bearish Scenario
A sustained move under 1.1756 will indicate the presence of sellers. The first downside target is the price cluster at 1.1706 to 1.1704. The latter is a potential trigger point for an acceleration to the downside with the next major downside target the November 4, 2020 main bottom at 1.1603.
Bullish Scenario
Overtaking 1.1756 will signal the presence of buyers. This could trigger a short-covering rally into the resistance cluster at 1.1805 to 1.808.
For a look at all of today’s economic events, check out our economic calendar.
This article was originally posted on FX Empire
