Even though Harmony Gold Mining (JSE:HAR) has lost R2.0b market cap in last 7 days, shareholders are still up 363% over 5 years
Buying shares in the best businesses can build meaningful wealth for you and your family. And we've seen some truly amazing gains over the years. To wit, the Harmony Gold Mining Company Limited (JSE:HAR) share price has soared 348% over five years. This just goes to show the value creation that some businesses can achieve. On top of that, the share price is up 63% in about a quarter.
Since the long term performance has been good but there's been a recent pullback of 3.5%, let's check if the fundamentals match the share price.
See our latest analysis for Harmony Gold Mining
Harmony Gold Mining isn't currently profitable, so most analysts would look to revenue growth to get an idea of how fast the underlying business is growing. Shareholders of unprofitable companies usually expect strong revenue growth. Some companies are willing to postpone profitability to grow revenue faster, but in that case one does expect good top-line growth.
For the last half decade, Harmony Gold Mining can boast revenue growth at a rate of 17% per year. That's well above most pre-profit companies. Arguably, this is well and truly reflected in the strong share price gain of 35%(per year) over the same period. It's never too late to start following a top notch stock like Harmony Gold Mining, since some long term winners go on winning for decades. On the face of it, this looks lke a good opportunity, although we note sentiment seems very positive already.
The graphic below depicts how earnings and revenue have changed over time (unveil the exact values by clicking on the image).
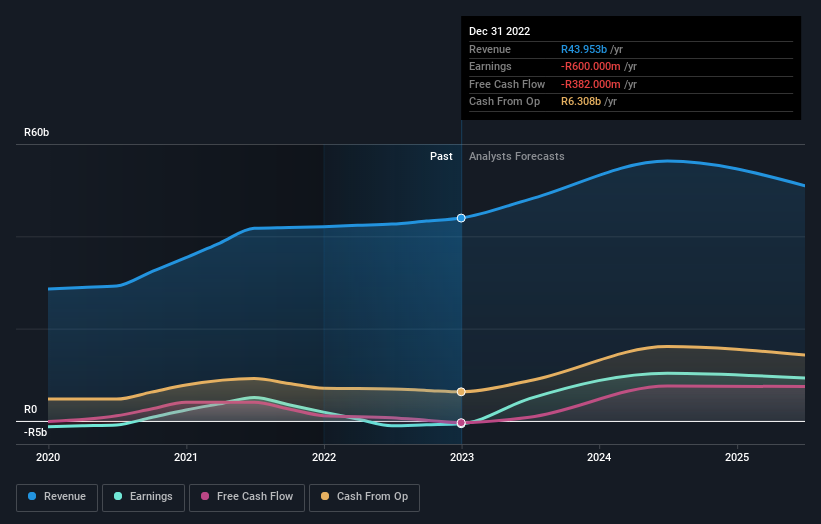
Balance sheet strength is crucial. It might be well worthwhile taking a look at our free report on how its financial position has changed over time.
What About Dividends?
It is important to consider the total shareholder return, as well as the share price return, for any given stock. Whereas the share price return only reflects the change in the share price, the TSR includes the value of dividends (assuming they were reinvested) and the benefit of any discounted capital raising or spin-off. It's fair to say that the TSR gives a more complete picture for stocks that pay a dividend. As it happens, Harmony Gold Mining's TSR for the last 5 years was 363%, which exceeds the share price return mentioned earlier. And there's no prize for guessing that the dividend payments largely explain the divergence!
A Different Perspective
We're pleased to report that Harmony Gold Mining shareholders have received a total shareholder return of 81% over one year. Of course, that includes the dividend. That gain is better than the annual TSR over five years, which is 36%. Therefore it seems like sentiment around the company has been positive lately. Someone with an optimistic perspective could view the recent improvement in TSR as indicating that the business itself is getting better with time. It's always interesting to track share price performance over the longer term. But to understand Harmony Gold Mining better, we need to consider many other factors. Consider for instance, the ever-present spectre of investment risk. We've identified 1 warning sign with Harmony Gold Mining , and understanding them should be part of your investment process.
Of course, you might find a fantastic investment by looking elsewhere. So take a peek at this free list of companies we expect will grow earnings.
Please note, the market returns quoted in this article reflect the market weighted average returns of stocks that currently trade on South African exchanges.
Have feedback on this article? Concerned about the content? Get in touch with us directly. Alternatively, email editorial-team (at) simplywallst.com.
This article by Simply Wall St is general in nature. We provide commentary based on historical data and analyst forecasts only using an unbiased methodology and our articles are not intended to be financial advice. It does not constitute a recommendation to buy or sell any stock, and does not take account of your objectives, or your financial situation. We aim to bring you long-term focused analysis driven by fundamental data. Note that our analysis may not factor in the latest price-sensitive company announcements or qualitative material. Simply Wall St has no position in any stocks mentioned.
Join A Paid User Research Session
You’ll receive a US$30 Amazon Gift card for 1 hour of your time while helping us build better investing tools for the individual investors like yourself. Sign up here
