Can EVERTEC Inc’s (EVTC) ROE Continue To Surpass The Industry Average?

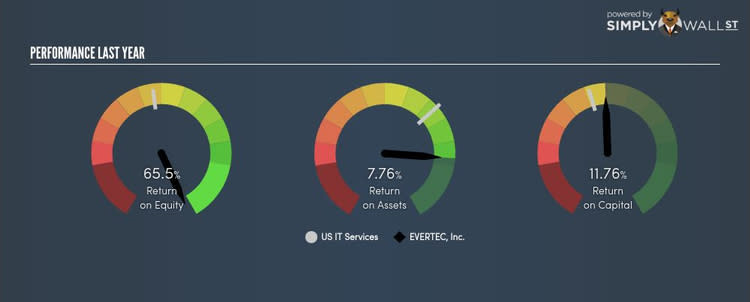
With an ROE of 65.50%, EVERTEC Inc (NYSE:EVTC) outpaced its own industry which delivered a less exciting 14.79% over the past year. On the surface, this looks fantastic since we know that EVTC has made large profits from little equity capital; however, ROE doesn’t tell us if management have borrowed heavily to make this happen. In this article, we’ll closely examine some factors like financial leverage to evaluate the sustainability of EVTC’s ROE. View our latest analysis for EVERTEC
What you must know about ROE
Firstly, Return on Equity, or ROE, is simply the percentage of last years’ earning against the book value of shareholders’ equity. For example, if EVTC invests $1 in the form of equity, it will generate $0.65 in earnings from this. In most cases, a higher ROE is preferred; however, there are many other factors we must consider prior to making any investment decisions.
Return on Equity = Net Profit ÷ Shareholders Equity
ROE is assessed against cost of equity, which is measured using the Capital Asset Pricing Model (CAPM) – but let’s not dive into the details of that today. For now, let’s just look at the cost of equity number for EVTC, which is 9.55%. Since EVTC’s return covers its cost in excess of 55.95%, its use of equity capital is efficient and likely to be sustainable. Simply put, EVTC pays less for its capital than what it generates in return. ROE can be dissected into three distinct ratios: net profit margin, asset turnover, and financial leverage. This is called the Dupont Formula:
Dupont Formula
ROE = profit margin × asset turnover × financial leverage
ROE = (annual net profit ÷ sales) × (sales ÷ assets) × (assets ÷ shareholders’ equity)
ROE = annual net profit ÷ shareholders’ equity
Essentially, profit margin shows how much money the company makes after paying for all its expenses. Asset turnover shows how much revenue EVTC can generate with its current asset base. The most interesting ratio, and reflective of sustainability of its ROE, is financial leverage. Since financial leverage can artificially inflate ROE, we need to look at how much debt EVTC currently has. Currently the debt-to-equity ratio stands at more than 2.5 times, which means its above-average ROE is driven by significant debt levels.

What this means for you:
Are you a shareholder? EVTC’s above-industry ROE is encouraging, and is also in excess of its cost of equity. However, its high debt level appears to be the driver of a strong ROE and is something you should be mindful of before adding more of EVTC to your portfolio.
Are you a potential investor? If you are considering investing in EVTC, basing your decision on ROE alone is certainly not sufficient. I recommend you do additional fundamental analysis by looking through our most recent infographic report on EVERTEC to help you make a more informed investment decision. If you are not interested in EVTC anymore, you can use our free platform to see our list of stocks with Return on Equity over 20%.
To help readers see pass the short term volatility of the financial market, we aim to bring you a long-term focused research analysis purely driven by fundamental data. Note that our analysis does not factor in the latest price sensitive company announcements.
The author is an independent contributor and at the time of publication had no position in the stocks mentioned.
