Examining Bathurst Resources Limited’s (ASX:BRL) Weak Return On Capital Employed

Today we are going to look at Bathurst Resources Limited (ASX:BRL) to see whether it might be an attractive investment prospect. Specifically, we’re going to calculate its Return On Capital Employed (ROCE), in the hopes of getting some insight into the business.
First, we’ll go over how we calculate ROCE. Then we’ll compare its ROCE to similar companies. Finally, we’ll look at how its current liabilities affect its ROCE.
What is Return On Capital Employed (ROCE)?
ROCE measures the amount of pre-tax profits a company can generate from the capital employed in its business. Generally speaking a higher ROCE is better. Overall, it is a valuable metric that has its flaws. Author Edwin Whiting says to be careful when comparing the ROCE of different businesses, since ‘No two businesses are exactly alike.’
How Do You Calculate Return On Capital Employed?
The formula for calculating the return on capital employed is:
Return on Capital Employed = Earnings Before Interest and Tax (EBIT) ÷ (Total Assets – Current Liabilities)
Or for Bathurst Resources:
0.016 = NZ$1.7m ÷ (NZ$119m – NZ$10m) (Based on the trailing twelve months to June 2018.)
So, Bathurst Resources has an ROCE of 1.6%.
View our latest analysis for Bathurst Resources
Want to help shape the future of investing tools? Participate in a short research study and receive a 6-month subscription to the award winning Simply Wall St research tool (valued at $60)!
Is Bathurst Resources’s ROCE Good?
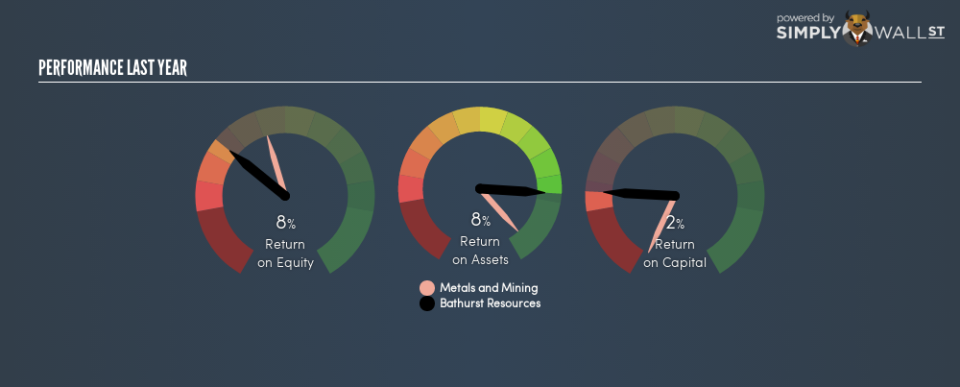
ROCE can be useful when making comparisons, such as between similar companies. In this analysis, Bathurst Resources’s ROCE appears meaningfully below the 12% average reported by the Metals and Mining industry. This performance is not ideal, as it suggests the company may not be deploying its capital as effectively as some competitors. Independently of how Bathurst Resources compares to its industry, its ROCE in absolute terms is low; especially compared to the ~2.3% available in government bonds. Readers may wish to look for more rewarding investments.
Bathurst Resources has an ROCE of 1.6%, but it didn’t have an ROCE 3 years ago, since it was unprofitable. This makes us wonder if the company is improving.
It is important to remember that ROCE shows past performance, and is not necessarily predictive. ROCE can be deceptive for cyclical businesses, as returns can look incredible in boom times, and terribly low in downturns. ROCE is only a point-in-time measure. Remember that most companies like Bathurst Resources are cyclical businesses. Future performance is what matters, and you can see analyst predictions in our free report on analyst forecasts for the company.
Do Bathurst Resources’s Current Liabilities Skew Its ROCE?
Current liabilities are short term bills and invoices that need to be paid in 12 months or less. The ROCE equation subtracts current liabilities from capital employed, so a company with a lot of current liabilities appears to have less capital employed, and a higher ROCE than otherwise. To counteract this, we check if a company has high current liabilities, relative to its total assets.
Bathurst Resources has total assets of NZ$119m and current liabilities of NZ$10m. As a result, its current liabilities are equal to approximately 8.4% of its total assets. Bathurst Resources has a low level of current liabilities, which have a negligible impact on its already low ROCE.
What We Can Learn From Bathurst Resources’s ROCE
Still, investors could probably find more attractive prospects with better performance out there. But note: Bathurst Resources may not be the best stock to buy. So take a peek at this free list of interesting companies with strong recent earnings growth (and a P/E ratio below 20).
If you are like me, then you will not want to miss this free list of growing companies that insiders are buying.
To help readers see past the short term volatility of the financial market, we aim to bring you a long-term focused research analysis purely driven by fundamental data. Note that our analysis does not factor in the latest price-sensitive company announcements.
The author is an independent contributor and at the time of publication had no position in the stocks mentioned. For errors that warrant correction please contact the editor at editorial-team@simplywallst.com.
