Examining Robinson Europe S.A.’s (WSE:RBS) Weak Return On Capital Employed
Want to participate in a short research study? Help shape the future of investing tools and you could win a $250 gift card!
Today we are going to look at Robinson Europe S.A. (WSE:RBS) to see whether it might be an attractive investment prospect. Specifically, we're going to calculate its Return On Capital Employed (ROCE), in the hopes of getting some insight into the business.
First of all, we'll work out how to calculate ROCE. Second, we'll look at its ROCE compared to similar companies. Finally, we'll look at how its current liabilities affect its ROCE.
Return On Capital Employed (ROCE): What is it?
ROCE measures the 'return' (pre-tax profit) a company generates from capital employed in its business. Generally speaking a higher ROCE is better. In brief, it is a useful tool, but it is not without drawbacks. Author Edwin Whiting says to be careful when comparing the ROCE of different businesses, since 'No two businesses are exactly alike.'
How Do You Calculate Return On Capital Employed?
The formula for calculating the return on capital employed is:
Return on Capital Employed = Earnings Before Interest and Tax (EBIT) ÷ (Total Assets - Current Liabilities)
Or for Robinson Europe:
0.095 = zł1.3m ÷ (zł21m - zł7.0m) (Based on the trailing twelve months to January 2019.)
So, Robinson Europe has an ROCE of 9.5%.
Check out our latest analysis for Robinson Europe
Is Robinson Europe's ROCE Good?
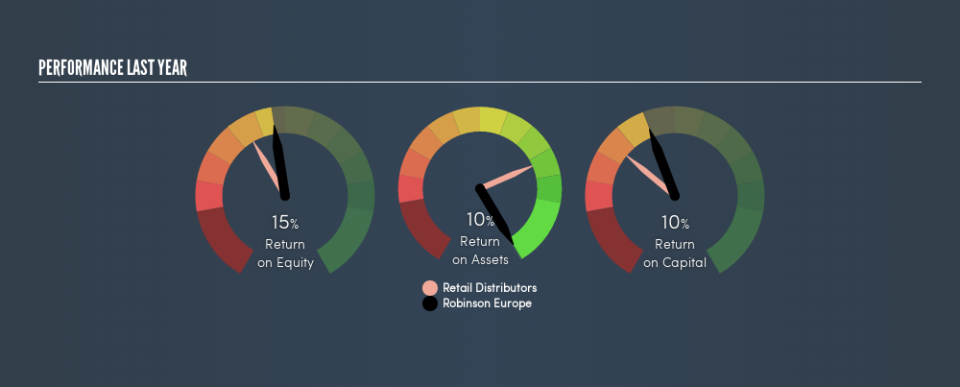
ROCE can be useful when making comparisons, such as between similar companies. We can see Robinson Europe's ROCE is meaningfully below the Retail Distributors industry average of 14%. This performance could be negative if sustained, as it suggests the business may underperform its industry. Aside from the industry comparison, Robinson Europe's ROCE is mediocre in absolute terms, considering the risk of investing in stocks versus the safety of a bank account. It is possible that there are more rewarding investments out there.
As we can see, Robinson Europe currently has an ROCE of 9.5% compared to its ROCE 3 years ago, which was 6.0%. This makes us think the business might be improving.
When considering ROCE, bear in mind that it reflects the past and does not necessarily predict the future. ROCE can be deceptive for cyclical businesses, as returns can look incredible in boom times, and terribly low in downturns. This is because ROCE only looks at one year, instead of considering returns across a whole cycle. You can check if Robinson Europe has cyclical profits by looking at this free graph of past earnings, revenue and cash flow.
What Are Current Liabilities, And How Do They Affect Robinson Europe's ROCE?
Current liabilities are short term bills and invoices that need to be paid in 12 months or less. The ROCE equation subtracts current liabilities from capital employed, so a company with a lot of current liabilities appears to have less capital employed, and a higher ROCE than otherwise. To check the impact of this, we calculate if a company has high current liabilities relative to its total assets.
Robinson Europe has total liabilities of zł7.0m and total assets of zł21m. Therefore its current liabilities are equivalent to approximately 34% of its total assets. Robinson Europe's middling level of current liabilities have the effect of boosting its ROCE a bit.
What We Can Learn From Robinson Europe's ROCE
Despite this, its ROCE is still mediocre, and you may find more appealing investments elsewhere. You might be able to find a better investment than Robinson Europe. If you want a selection of possible winners, check out this free list of interesting companies that trade on a P/E below 20 (but have proven they can grow earnings).
I will like Robinson Europe better if I see some big insider buys. While we wait, check out this free list of growing companies with considerable, recent, insider buying.
We aim to bring you long-term focused research analysis driven by fundamental data. Note that our analysis may not factor in the latest price-sensitive company announcements or qualitative material.
If you spot an error that warrants correction, please contact the editor at editorial-team@simplywallst.com. This article by Simply Wall St is general in nature. It does not constitute a recommendation to buy or sell any stock, and does not take account of your objectives, or your financial situation. Simply Wall St has no position in the stocks mentioned. Thank you for reading.
