Excel Force MSC Berhad's (KLSE:EFORCE) Stock Has Shown Weakness Lately But Financial Prospects Look Decent: Is The Market Wrong?
Excel Force MSC Berhad (KLSE:EFORCE) has had a rough month with its share price down 9.2%. However, the company's fundamentals look pretty decent, and long-term financials are usually aligned with future market price movements. Particularly, we will be paying attention to Excel Force MSC Berhad's ROE today.
ROE or return on equity is a useful tool to assess how effectively a company can generate returns on the investment it received from its shareholders. Simply put, it is used to assess the profitability of a company in relation to its equity capital.
Check out our latest analysis for Excel Force MSC Berhad
How Is ROE Calculated?
ROE can be calculated by using the formula:
Return on Equity = Net Profit (from continuing operations) ÷ Shareholders' Equity
So, based on the above formula, the ROE for Excel Force MSC Berhad is:
7.8% = RM8.2m ÷ RM105m (Based on the trailing twelve months to September 2022).
The 'return' is the amount earned after tax over the last twelve months. One way to conceptualize this is that for each MYR1 of shareholders' capital it has, the company made MYR0.08 in profit.
What Is The Relationship Between ROE And Earnings Growth?
Thus far, we have learned that ROE measures how efficiently a company is generating its profits. Depending on how much of these profits the company reinvests or "retains", and how effectively it does so, we are then able to assess a company’s earnings growth potential. Generally speaking, other things being equal, firms with a high return on equity and profit retention, have a higher growth rate than firms that don’t share these attributes.
Excel Force MSC Berhad's Earnings Growth And 7.8% ROE
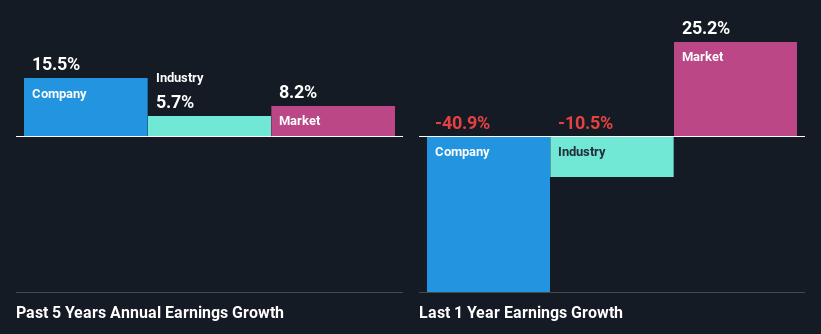
At first glance, Excel Force MSC Berhad's ROE doesn't look very promising. We then compared the company's ROE to the broader industry and were disappointed to see that the ROE is lower than the industry average of 10%. Excel Force MSC Berhad was still able to see a decent net income growth of 16% over the past five years. So, there might be other aspects that are positively influencing the company's earnings growth. For example, it is possible that the company's management has made some good strategic decisions, or that the company has a low payout ratio.
As a next step, we compared Excel Force MSC Berhad's net income growth with the industry, and pleasingly, we found that the growth seen by the company is higher than the average industry growth of 5.7%.
The basis for attaching value to a company is, to a great extent, tied to its earnings growth. The investor should try to establish if the expected growth or decline in earnings, whichever the case may be, is priced in. By doing so, they will have an idea if the stock is headed into clear blue waters or if swampy waters await. If you're wondering about Excel Force MSC Berhad's's valuation, check out this gauge of its price-to-earnings ratio, as compared to its industry.
Is Excel Force MSC Berhad Using Its Retained Earnings Effectively?
While Excel Force MSC Berhad has a three-year median payout ratio of 69% (which means it retains 31% of profits), the company has still seen a fair bit of earnings growth in the past, meaning that its high payout ratio hasn't hampered its ability to grow.
Besides, Excel Force MSC Berhad has been paying dividends for at least ten years or more. This shows that the company is committed to sharing profits with its shareholders.
Conclusion
On the whole, we do feel that Excel Force MSC Berhad has some positive attributes. While no doubt its earnings growth is pretty substantial, we do feel that the reinvestment rate is pretty low, meaning, the earnings growth number could have been significantly higher had the company been retaining more of its profits. Up till now, we've only made a short study of the company's growth data. To gain further insights into Excel Force MSC Berhad's past profit growth, check out this visualization of past earnings, revenue and cash flows.
Have feedback on this article? Concerned about the content? Get in touch with us directly. Alternatively, email editorial-team (at) simplywallst.com.
This article by Simply Wall St is general in nature. We provide commentary based on historical data and analyst forecasts only using an unbiased methodology and our articles are not intended to be financial advice. It does not constitute a recommendation to buy or sell any stock, and does not take account of your objectives, or your financial situation. We aim to bring you long-term focused analysis driven by fundamental data. Note that our analysis may not factor in the latest price-sensitive company announcements or qualitative material. Simply Wall St has no position in any stocks mentioned.
Join A Paid User Research Session
You’ll receive a US$30 Amazon Gift card for 1 hour of your time while helping us build better investing tools for the individual investors like yourself. Sign up here
