Exco Technologies Limited's (TSE:XTC) On An Uptrend But Financial Prospects Look Pretty Weak: Is The Stock Overpriced?
Exco Technologies (TSE:XTC) has had a great run on the share market with its stock up by a significant 11% over the last three months. However, in this article, we decided to focus on its weak fundamentals, as long-term financial performance of a business is what ultimately dictates market outcomes. Specifically, we decided to study Exco Technologies' ROE in this article.
Return on equity or ROE is an important factor to be considered by a shareholder because it tells them how effectively their capital is being reinvested. In short, ROE shows the profit each dollar generates with respect to its shareholder investments.
See our latest analysis for Exco Technologies
How Do You Calculate Return On Equity?
The formula for ROE is:
Return on Equity = Net Profit (from continuing operations) ÷ Shareholders' Equity
So, based on the above formula, the ROE for Exco Technologies is:
6.0% = CA$22m ÷ CA$365m (Based on the trailing twelve months to March 2023).
The 'return' is the yearly profit. Another way to think of that is that for every CA$1 worth of equity, the company was able to earn CA$0.06 in profit.
What Is The Relationship Between ROE And Earnings Growth?
So far, we've learned that ROE is a measure of a company's profitability. Based on how much of its profits the company chooses to reinvest or "retain", we are then able to evaluate a company's future ability to generate profits. Assuming everything else remains unchanged, the higher the ROE and profit retention, the higher the growth rate of a company compared to companies that don't necessarily bear these characteristics.
A Side By Side comparison of Exco Technologies' Earnings Growth And 6.0% ROE
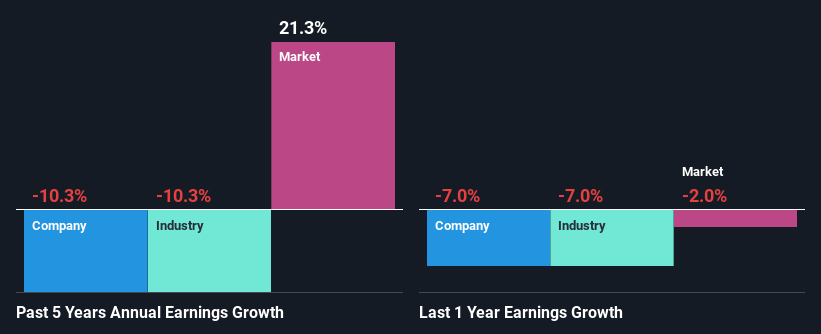
When you first look at it, Exco Technologies' ROE doesn't look that attractive. We then compared the company's ROE to the broader industry and were disappointed to see that the ROE is lower than the industry average of 7.8%. For this reason, Exco Technologies' five year net income decline of 10% is not surprising given its lower ROE. We reckon that there could also be other factors at play here. For instance, the company has a very high payout ratio, or is faced with competitive pressures.
From the 10% decline reported by the industry in the same period, we infer that Exco Technologies and its industry are both shrinking at a similar rate.
Earnings growth is a huge factor in stock valuation. It’s important for an investor to know whether the market has priced in the company's expected earnings growth (or decline). By doing so, they will have an idea if the stock is headed into clear blue waters or if swampy waters await. If you're wondering about Exco Technologies''s valuation, check out this gauge of its price-to-earnings ratio, as compared to its industry.
Is Exco Technologies Using Its Retained Earnings Effectively?
With a high three-year median payout ratio of 55% (implying that 45% of the profits are retained), most of Exco Technologies' profits are being paid to shareholders, which explains the company's shrinking earnings. The business is only left with a small pool of capital to reinvest - A vicious cycle that doesn't benefit the company in the long-run. To know the 2 risks we have identified for Exco Technologies visit our risks dashboard for free.
Additionally, Exco Technologies has paid dividends over a period of at least ten years, which means that the company's management is determined to pay dividends even if it means little to no earnings growth.
Conclusion
Overall, we would be extremely cautious before making any decision on Exco Technologies. As a result of its low ROE and lack of much reinvestment into the business, the company has seen a disappointing earnings growth rate. So far, we've only made a quick discussion around the company's earnings growth. You can do your own research on Exco Technologies and see how it has performed in the past by looking at this FREE detailed graph of past earnings, revenue and cash flows.
Have feedback on this article? Concerned about the content? Get in touch with us directly. Alternatively, email editorial-team (at) simplywallst.com.
This article by Simply Wall St is general in nature. We provide commentary based on historical data and analyst forecasts only using an unbiased methodology and our articles are not intended to be financial advice. It does not constitute a recommendation to buy or sell any stock, and does not take account of your objectives, or your financial situation. We aim to bring you long-term focused analysis driven by fundamental data. Note that our analysis may not factor in the latest price-sensitive company announcements or qualitative material. Simply Wall St has no position in any stocks mentioned.
Join A Paid User Research Session
You’ll receive a US$30 Amazon Gift card for 1 hour of your time while helping us build better investing tools for the individual investors like yourself. Sign up here
