Expedia Group's (EXPE) Q2 Earnings Beat, Revenues Rise Y/Y
Expedia Group, Inc. EXPE delivered second-quarter 2023 adjusted earnings of $2.89 per share, up 48% from the year-ago quarter. The figure beat the Zacks Consensus Estimate by 24.6%.
Revenues of $3.36 billion rose 6% year over year. The figure missed the Zacks Consensus Estimate of $3.37 billion.
Year-over-year revenue growth was driven by solid travel demand. The strong performance delivered by the B2B segment of the company contributed well.
This apart, growing gross bookings owing to solid momentum in the ‘booked room nights’ metric was a positive.
However, softness in Trivago was a concern.
The uncertain macroeconomic environment remains a negative.
Coming to price performance, Expedia has gained 12.7% in the year-to-date period, underperforming the industry’s growth of 34.5%.
EXPE’s growing efforts toward strengthening its products and technology offerings for customers remain noteworthy. The company’s initiative to infuse generative AI technology into its services is expected to drive customer momentum by delivering an enhanced user experience. Strength in the company’s loyalty programs is likely to bolster its customer base. These factors will likely benefit its financial performance in the days ahead and instill investor optimism in the stock.
Expedia Group, Inc. Price, Consensus and EPS Surprise
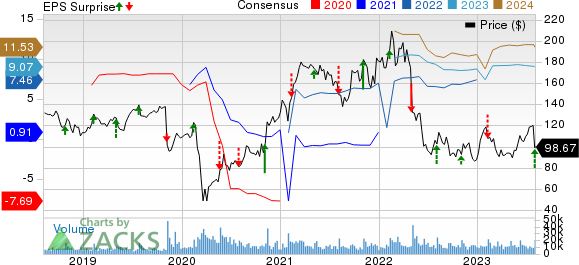
Expedia Group, Inc. price-consensus-eps-surprise-chart | Expedia Group, Inc. Quote
Top-Line in Detail
Revenues by Segment
B2C: Expedia generated $2.42 billion in revenues (72% of the total revenues) from the segment, falling 0.2% year over year.
B2B: The segment yielded revenues of $861 million (26% of the total revenues), up 32.5% from the year-ago quarter’s level.
Trivago: Revenues from the segment totaled $82 million (2% of the total revenues), down 26.1% year over year.
Revenues by Region
Expedia generated $2.17 billion in revenues (64.7% of the total revenues) from U.S. points of sale, down 1.6% from the prior-year quarter’s level.
Revenues generated by non-U.S. points of sale totaled $1.19 billion (35.3% of the total revenues), up 21.9% on a year-over-year basis.
Revenues by Product Line
Lodging revenues were $2.7 billion, accounting for 80.3% of the total revenues. EXPE witnessed 12.4% growth in Lodging revenues on a year-over-year basis.
Air revenues were $111 million, representing 3.3% of the total revenues. EXPE witnessed a 16.8% rise in Air revenues. It also experienced 0.7% year-over-year growth in ‘booked air tickets’.
Advertising and media generated revenues of $201 million, down 5.6% from the prior-year quarter. The figure accounted for 6% of the total revenues.
Other revenues were $348 million (10.4% of total revenues), down 26.4% year over year.
Gross Bookings
Expedia’s gross bookings were $27.32 billion, which increased 5% year over year. The reported figure missed the Zacks Consensus Estimate of $28.95 billion.
Agency’s gross bookings were $12.4 billion (45.3% of gross bookings), down 3.1% year over year. The figure lagged the consensus mark of $13.7 billion.
Merchant’s gross bookings were $14.95 billion (54.7%), up 11.9% from the prior-year quarter’s figure. The figure came below the consensus mark of $15.25 billion.
Strong momentum in lodging gross bookings, which grew 7.3% year over year, contributed well. Strength in ‘booked room nights,’ which surged 9% from the year-ago quarter, was a positive.
Operating Details
Adjusted EBITDA was $747 million in the reported quarter, up 15% from the year-ago quarter’s level.
Adjusted selling and marketing expenses were $1.75 billion, up 3% year over year. As a percentage of revenues, the figure contracted 130 basis points (bps) year over year.
Adjusted general and administrative expenses were $148 million, up 3.5% year over year. The figure contracted 10 bps year over year as a percentage of revenues.
Adjusted technology and content expenses were $308 million, up 19.8% from the year-ago quarter’s level. The figure expanded 110 bps from the year-ago quarter’s figure as a percentage of revenues.
EXPE reported a second-quarter operating income of $443 million, which increased 28% year over year. Operating margin was 13.2%, which expanded 240 bps from the year-ago quarter.
Balance Sheet & Cash Flow
As of Jun 30, 2023, cash and cash equivalents were $6.3 billion, up from $5.9 billion as of Mar 31, 2023. Short-term investments were $27 million compared with $44 million at the end of the previous quarter.
Long-term debt was $6.247 billion at the end of the second quarter compared with $6.243 billion at the end of the first quarter.
Expedia generated $1.15 billion in cash from operations during the quarter under review compared with $3.2 billion cash used in operations in the previous quarter.
Free cash flow was $923 million in the second quarter.
Zacks Rank & Stocks to Consider
Currently, Expedia carries a Zacks Rank #3 (Hold).
Some better-ranked stocks in the retail-wholesale sector are BJ’s Restaurants BJRI, Domino’s Pizza DPZ and Lithia Motors LAD. While BJ’s Restaurants and Domino’s Pizza sport a Zacks Rank #1 (Strong Buy), Lithia Motors carries a Zacks Rank #2 (Buy).
You can see the complete list of today’s Zacks #1 Rank stocks here.
BJ’s Restaurants has gained 37.3% on a year-to-date basis. The long-term earnings growth rate for BJRI is currently projected at 15%.
Domino’s Pizza has gained 15.9% on a year-to-date basis. The long-term earnings growth rate for DPZ is currently projected at 12.97%.
Lithia Motors has gained 47.6% on a year-to-date basis. The long-term earnings growth rate for LAD is currently projected at 3%.
Want the latest recommendations from Zacks Investment Research? Today, you can download 7 Best Stocks for the Next 30 Days. Click to get this free report
BJ's Restaurants, Inc. (BJRI) : Free Stock Analysis Report
Domino's Pizza Inc (DPZ) : Free Stock Analysis Report
Expedia Group, Inc. (EXPE) : Free Stock Analysis Report
Lithia Motors, Inc. (LAD) : Free Stock Analysis Report
