Experian plc's (LON:EXPN) Stock Been Rising: Are Strong Financials Guiding The Market?
Experian's (LON:EXPN) stock is up by 7.1% over the past three months. Given its impressive performance, we decided to study the company's key financial indicators as a company's long-term fundamentals usually dictate market outcomes. Particularly, we will be paying attention to Experian's ROE today.
Return on Equity or ROE is a test of how effectively a company is growing its value and managing investors’ money. In simpler terms, it measures the profitability of a company in relation to shareholder's equity.
View our latest analysis for Experian
How Do You Calculate Return On Equity?
Return on equity can be calculated by using the formula:
Return on Equity = Net Profit (from continuing operations) ÷ Shareholders' Equity
So, based on the above formula, the ROE for Experian is:
25% = US$1.0b ÷ US$4.2b (Based on the trailing twelve months to September 2023).
The 'return' is the amount earned after tax over the last twelve months. So, this means that for every £1 of its shareholder's investments, the company generates a profit of £0.25.
What Has ROE Got To Do With Earnings Growth?
Thus far, we have learned that ROE measures how efficiently a company is generating its profits. Depending on how much of these profits the company reinvests or "retains", and how effectively it does so, we are then able to assess a company’s earnings growth potential. Assuming everything else remains unchanged, the higher the ROE and profit retention, the higher the growth rate of a company compared to companies that don't necessarily bear these characteristics.
Experian's Earnings Growth And 25% ROE
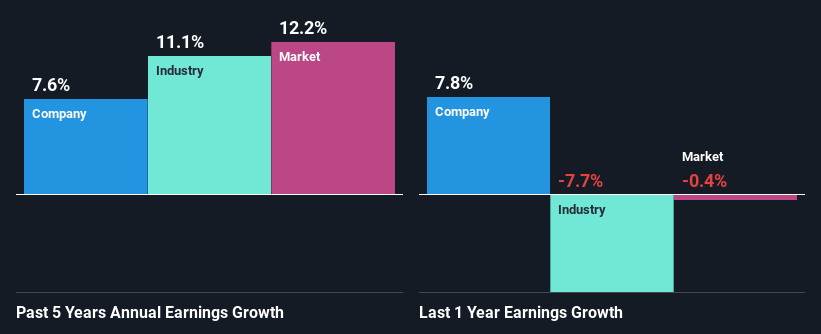
Firstly, we acknowledge that Experian has a significantly high ROE. Second, a comparison with the average ROE reported by the industry of 14% also doesn't go unnoticed by us. This probably laid the groundwork for Experian's moderate 7.6% net income growth seen over the past five years.
Next, on comparing with the industry net income growth, we found that Experian's reported growth was lower than the industry growth of 11% over the last few years, which is not something we like to see.
The basis for attaching value to a company is, to a great extent, tied to its earnings growth. It’s important for an investor to know whether the market has priced in the company's expected earnings growth (or decline). Doing so will help them establish if the stock's future looks promising or ominous. Has the market priced in the future outlook for EXPN? You can find out in our latest intrinsic value infographic research report.
Is Experian Making Efficient Use Of Its Profits?
Experian has a three-year median payout ratio of 50%, which implies that it retains the remaining 50% of its profits. This suggests that its dividend is well covered, and given the decent growth seen by the company, it looks like management is reinvesting its earnings efficiently.
Additionally, Experian has paid dividends over a period of at least ten years which means that the company is pretty serious about sharing its profits with shareholders. Upon studying the latest analysts' consensus data, we found that the company's future payout ratio is expected to drop to 38% over the next three years. However, the company's ROE is not expected to change by much despite the lower expected payout ratio.
Summary
In total, we are pretty happy with Experian's performance. Particularly, we like that the company is reinvesting heavily into its business, and at a high rate of return. As a result, the decent growth in its earnings is not surprising. With that said, the latest industry analyst forecasts reveal that the company's earnings are expected to accelerate. To know more about the latest analysts predictions for the company, check out this visualization of analyst forecasts for the company.
Have feedback on this article? Concerned about the content? Get in touch with us directly. Alternatively, email editorial-team (at) simplywallst.com.
This article by Simply Wall St is general in nature. We provide commentary based on historical data and analyst forecasts only using an unbiased methodology and our articles are not intended to be financial advice. It does not constitute a recommendation to buy or sell any stock, and does not take account of your objectives, or your financial situation. We aim to bring you long-term focused analysis driven by fundamental data. Note that our analysis may not factor in the latest price-sensitive company announcements or qualitative material. Simply Wall St has no position in any stocks mentioned.
