Exploring Kinder Morgan's Renewed Growth
Over the last several years, Kinder Morgan Inc. (NYSE:KMI) has experienced a highly elevated amount of negative sentiment from short- and long-term investors alike. Much of this negative sentiment can be traced back to 2014, where in its 2015 guidance, the company projected promising financial outlooks ranging from a 16% boost in dividends to $2 per share as well as an expected $8.20 billion increase in profits as a result of its robust expansion projects during the time.
Kinder Morgan during this time was considered a very safe investment given its rising dividends and its status of being among the biggest industrial midstream oil and natural gas company in the U.S., as well as owning some of the country's largest networks of natural gas pipelines, competing with U.S.-based midstream energy giants such as Cheniere Energy (LNG) and the Williams Companies (NYSE:WMB).
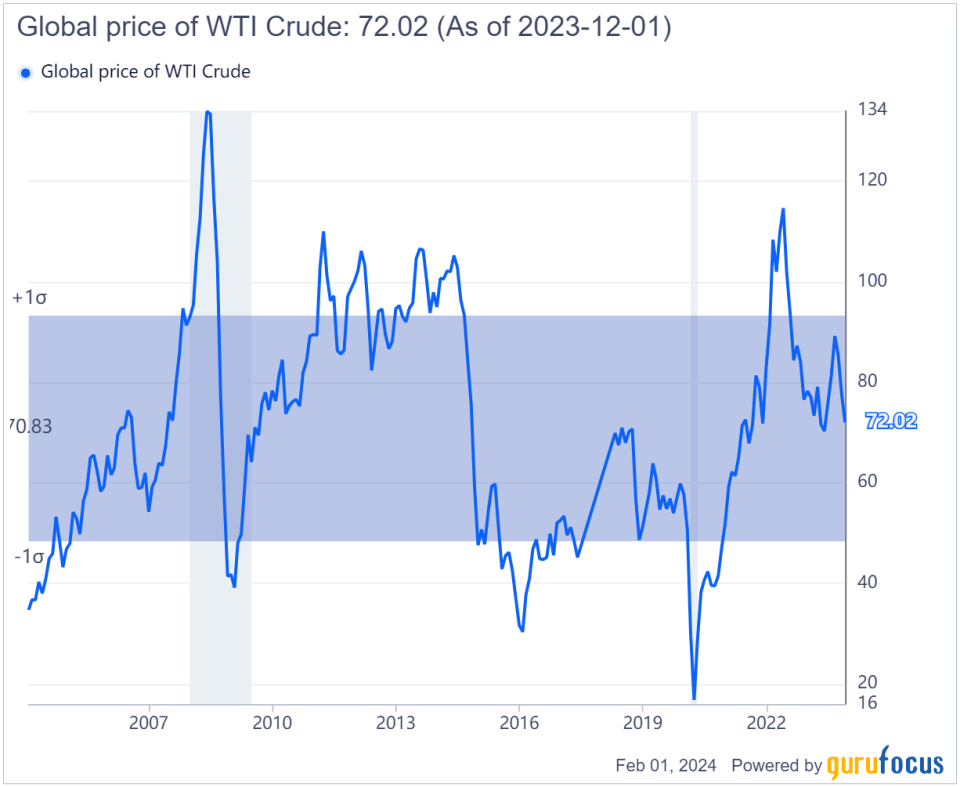
However, much of Kinder Morgan's projected 2015 growth was reliant on the realization of the company's forecasts, which heavily hinged on one very important variable: its assumption that the West Texas Intermediate Crude Oil price would remain at an average of $70 per barrel during the year. This was not how things would end up playing out as, during that year, crude oil entered into a deep bear market and crashed below the $70 level and continued this decline all the way down to $15 a barrel in 2020, where it then bottomed out and has since partially recovered.
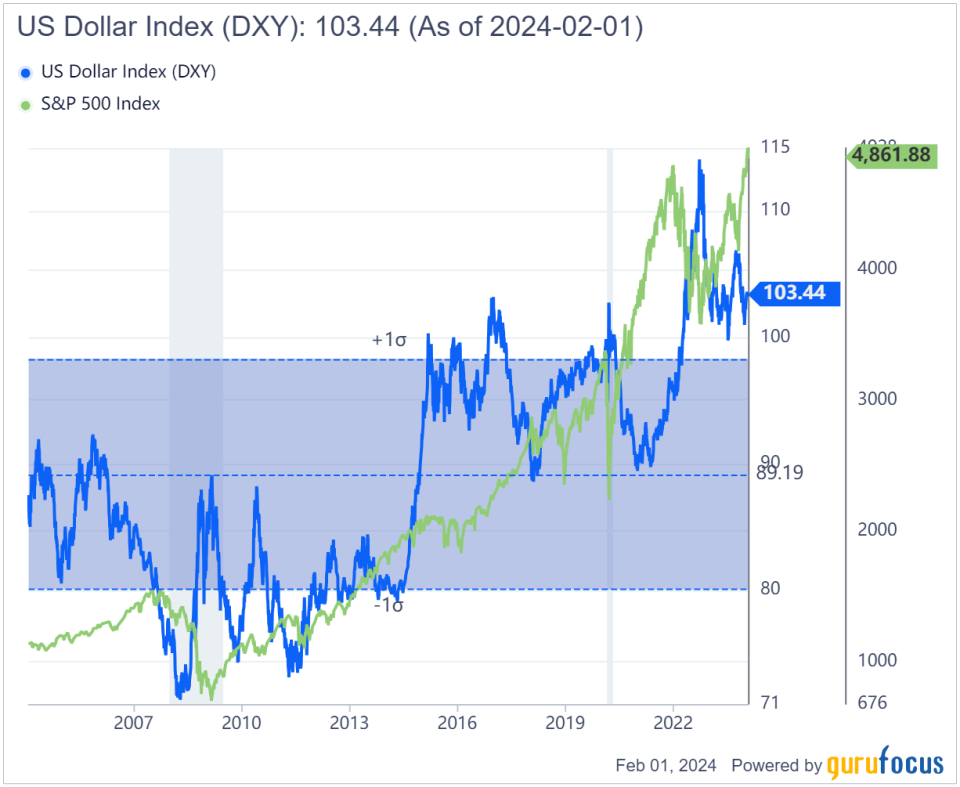
This bear market in oil was a result of increased production paired with especially weak conditions in the Chinese economy and generally decreased global demand, leading to higher supply and lower prices. During this time, the U.S. Federal Reserve also began a tightening cycle where it started to raise the federal funds rate. This led to rising treasury yields and even tighter global financial conditions. These tighter conditions put negative pressure on not only oil commodities, but also ended up crushing commodity demand in all sectors as a whole, along with causing a wide-scale selloff in equities, resulting in the U.S. dollar Index greatly strengthening, going from a value of $80 in July 2014 to a value of $100 by the end of 2015 and the S&P 500 index going down 17% during the same period.
The decreased commodity demand can be visualized in the activity of the S&P Goldman Sachs Commodity Index (represented by the red line). It can be seen that the commodity index began its bear market around the time the Fed began to raise interest rates. Also during that time, the strength of the Chinese economy and consumer were in deep decline. As a result, the commodity index fell over 60% from its 2014 closing high of $659 to its 2020 low of $255, from where it has since recovered, likely thanks to the Federal Reserve lowering rates at an incredible pace in 2020 during the pandemic and injecting liquidity into capital markets in the form of buying corporate and treasury securities through the exponential raising of the balance sheet. This action by the Fed has had an extremely high inflationary effect on the economy that is still felt presently in 2024.
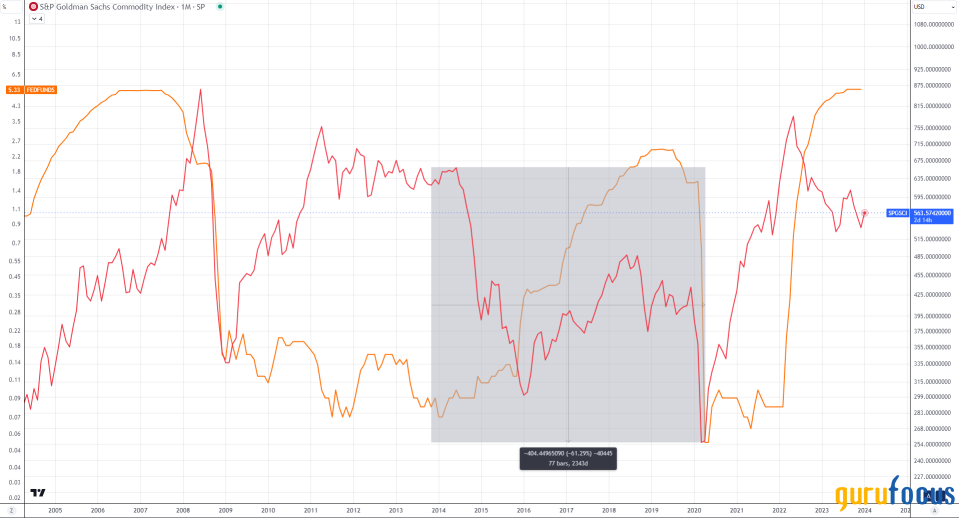
Source: tradingview.com
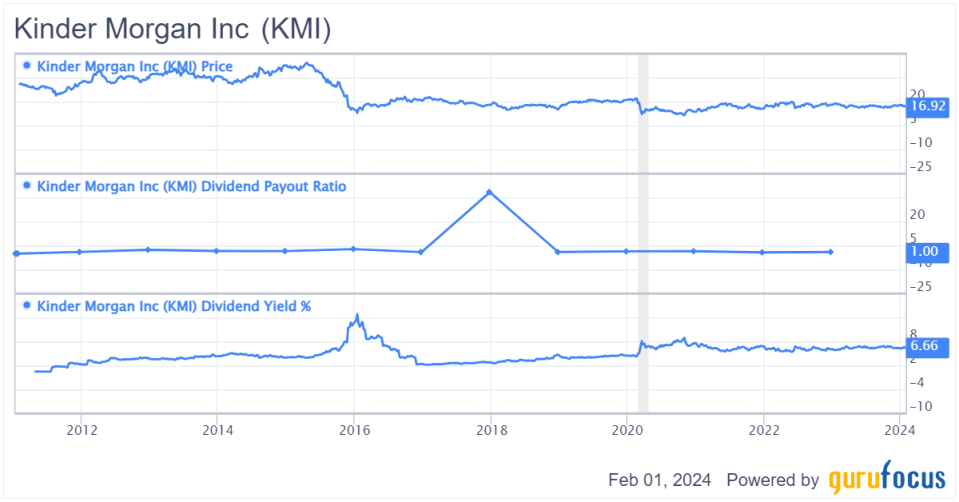
Upon reviewing the all of the data above, it is apparent that Kinder Morgan's oil price and profit projections were thrown well off course due to the unforeseen effects of the monetary tightening as well as the economic slowdown in China. As a result of the hard times, the company ended up shaving off 72% of its dividend payout during the period of Oct. 29, 2015 and Oct. 28, 2016, going from $1.26 per share at a yield of 10.29% to just 35 cents at a yield of 2.52%.
KMI Data by GuruFocus
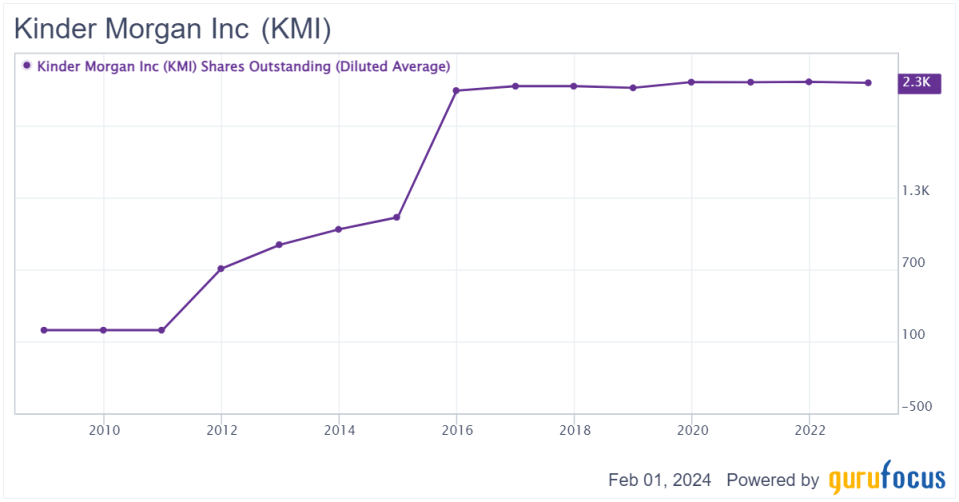
The company also missed big on its forward guidance for 2015 in most, if not all, segments. During this time, revenues were going down, operating expenses were rising and the company's debt ratios were rising to unsustainable levels. This led to Moody's downgrading Kinder Morgan's outlook to negative just before the end of the year and worst of all, this bad news came when the company had decided to heavily dilute its investors shares, going from just over 1 billion outstanding shares in 2014 to over 2 billion shares in the first quarter of 2015.
KMI Data by GuruFocus
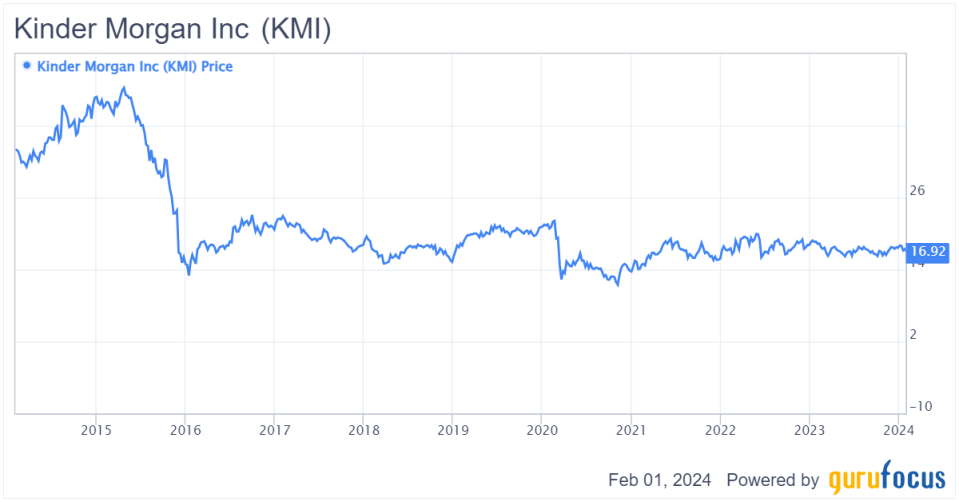
Investors throughout most of this negative news held onto the stock due to its high dividend, but the moment it cut the dividend, they fled, resulting in a massive 65% selloff within a three-month period, going from the high of $21.50 in October 2015 to the low of $7.50 in January 2016. Since then, shares have seen a partial recovery as investors attempt to realize the company's current value. This rise comes at a time when financial conditions seem to have steadily improved. To add to investors' recent confidence, Kinder Morgan has also been buying back shares and raising dividends again at a moderate pace.
KMI Data by GuruFocus
A new trend of positivity
During the company's toughest times, it was fortunate enough to have a decent cash position. It leveraged its strong cash position to acquire and expand its operations, mainly into new natural gas pipeline infrastructure. Many of these acquisitions were successful given that valuations across the entire sector were down at the time, so it was able to acquire them at a discount.
Source: macrotrends.net
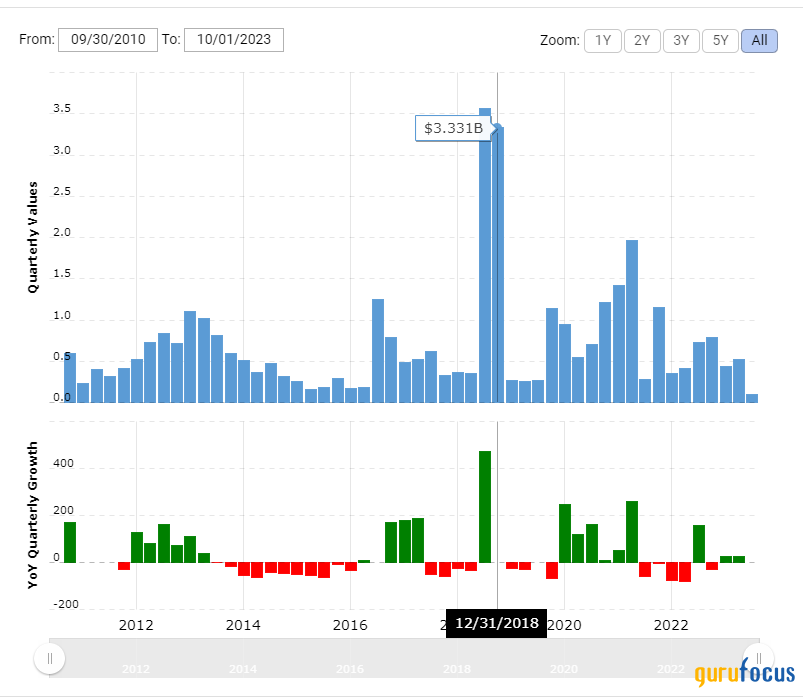
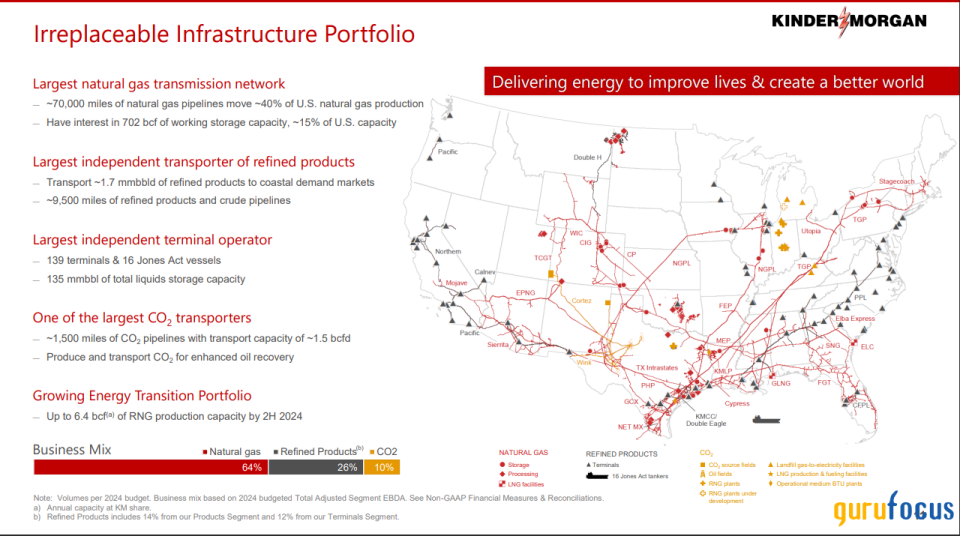
After the events of 2015, the company through its investments started to realize rising operating cash flows in spite of the commodity pricing remaining low. These rising cash flows would often translate into relatively high amounts of cash suddenly being on hand every other quarter, followed by the cash going back down as it would then invest back into its pipeline expansion and even new operations such as natural gas exports, which can be seen on the map below. Kinder Morgan now has 16 LNG tankers that it has begun utilizing for international transport. It has also invested in more LNG storage facilities and an even greater amount of pipelines. The company provided an extensive map overview of its current assets in its annual review.
Source: Kinder Morgan annual review
In this section of the annual review, Kinder Morgan showcased itself as the distinct operator of the largest natural gas transmission network in the U.S., comprising approximately 70,000 miles of natural gas pipelines. It then detailed that its extensive network plays a critical role in moving around 40% of the country's natural gas production. Additionally, it holds a significant interest in 702 billion cubic feet of working storage capacity, constituting approximately 15% of the total storage capacity in the U.S.
As the largest independent transporter of refined products, Kinder Morgan facilitates the movement of approximately 1.7 million barrels per day of refined products to coastal demand markets, while also managing an impressive infrastructure of pipelines stretching around 9,500 miles dedicated to refined products and crude oil transportation.
Kinder Morgan further solidifies its industry position as the largest independent terminal operator, overseeing 139 terminals and operating 16 Jones Act vessels. The total liquid storage capacity amounts to 135 million barrels.
The company also emerges as one of the largest CO2 transporters, managing a network of pipelines stretching approximately 1,500 miles with a transport capacity of approximately 1.5 billion cubic feet per day. The company plays a crucial role in producing and transporting CO2 for enhanced oil recovery.
The review also details that Kinder Morgan is actively expanding its portfolio so that by the second half of 2024, it will include the additional capacity to produce up to 6.4 billion cubic feet of renewable natural gas, thus making its operations compatible with a greener future.
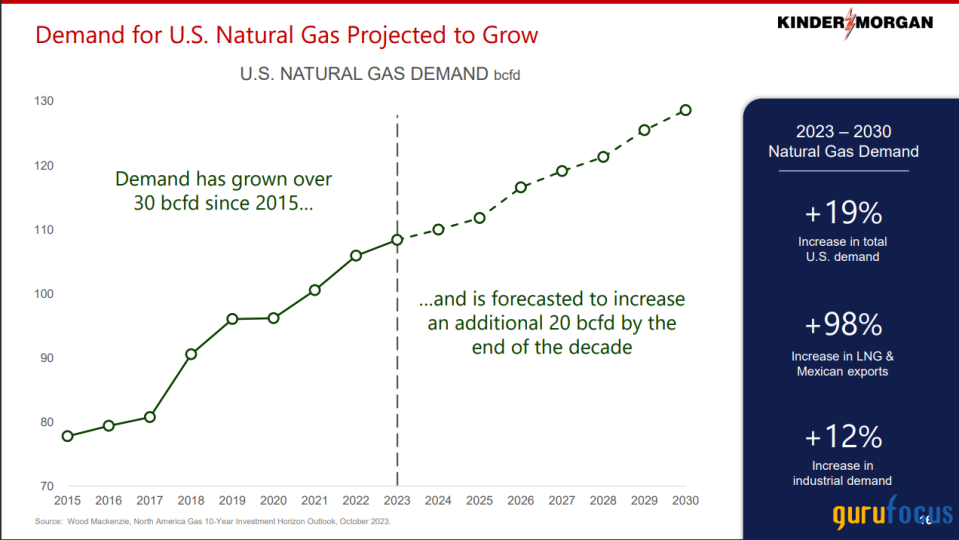
The report noted the demand for LNG has increased 30 bcfd since 2015, which also showed a 19% increase in U.S. demand and 98% increase in LNG and Mexican exports as well as a 12% increase in industrial demand.
Source: Kinder Morgan annual review
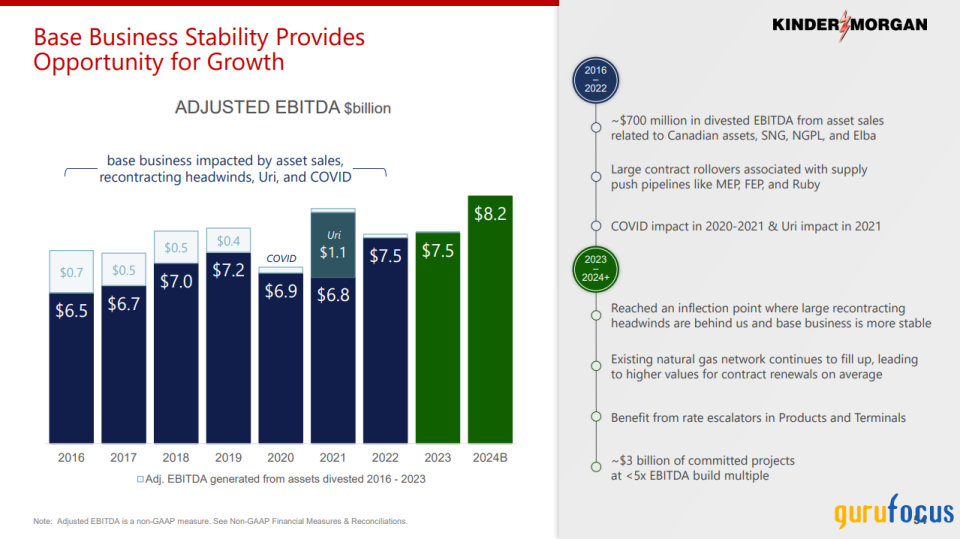
We can also see in this review that the company's Ebitda has risen from 2016 lows and with the exception of the Covid-19 pandemic, has seen year-over-year growth with a major bump to $8.2 billion being projected for this year.
Source: Kinder Morgan annual review
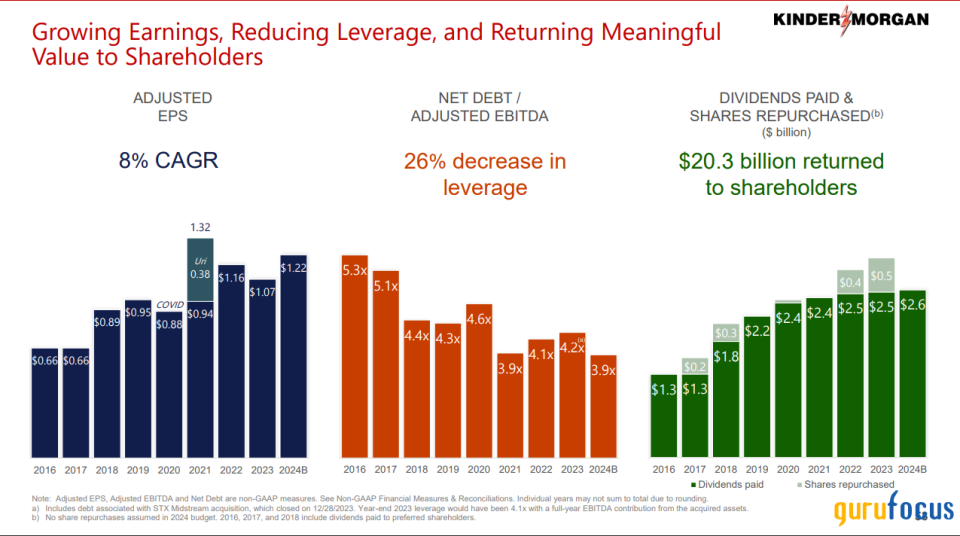
Most importantly, we can see a moderate trend of year-over-year improvements in earnings per share, which are expected to be higher in 2024. %he company's leveraged debt-to-Ebitda ratio has fallen 26% since 2016, starting a 5.30 and currently standing at 4.20. Lastly, the company has also given back $20.3 billion to its shareholders in the form of dividends and buybacks.
Source: Kinder Morgan annual review
Conclusion and technical outlook
Over the last several years, Kinder Morgan as put a lot of effort into undoing the negative situations it found itself in during the 2015 bear market. This has resulted in share prices recovering from the ultimate lows, but has yet to give the majority of investors enough certainty to buy above the topside resistance of the trading range at $17.65, but has at least given investors enough confidence to consolidate near the topside resistance.
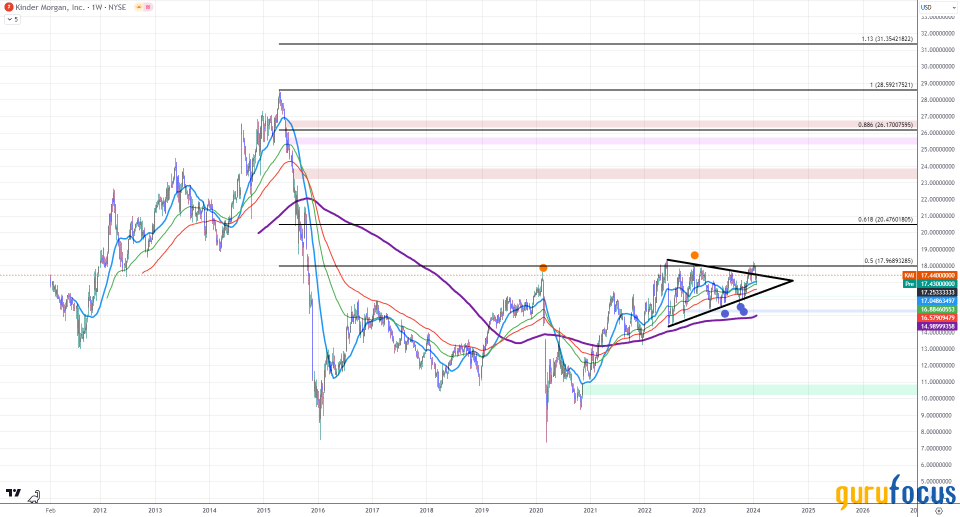
In this time, the price action has formed what appears to be a bullish pennant and has confirmed the 21-week simple moving average as support. If the levels hold, we would likely break out successfully and land near the 0.88 Fibonacci retracement, aligning with $26.17. This moment of consolidation looks like it may prove to be a moment in time to take advantage of overly bearish investor sentiment to buy the stock at deep-value levels and stands out to me as being one of the more intriguing plays in the energy market.
This article first appeared on GuruFocus.
