What Is F.N.B's (NYSE:FNB) P/E Ratio After Its Share Price Tanked?

To the annoyance of some shareholders, F.N.B (NYSE:FNB) shares are down a considerable 50% in the last month. That drop has capped off a tough year for shareholders, with the share price down 44% in that time.
Assuming nothing else has changed, a lower share price makes a stock more attractive to potential buyers. While the market sentiment towards a stock is very changeable, in the long run, the share price will tend to move in the same direction as earnings per share. So, on certain occasions, long term focussed investors try to take advantage of pessimistic expectations to buy shares at a better price. One way to gauge market expectations of a stock is to look at its Price to Earnings Ratio (PE Ratio). Investors have optimistic expectations of companies with higher P/E ratios, compared to companies with lower P/E ratios.
View our latest analysis for F.N.B
Does F.N.B Have A Relatively High Or Low P/E For Its Industry?
We can tell from its P/E ratio of 5.04 that sentiment around F.N.B isn't particularly high. We can see in the image below that the average P/E (8.3) for companies in the banks industry is higher than F.N.B's P/E.
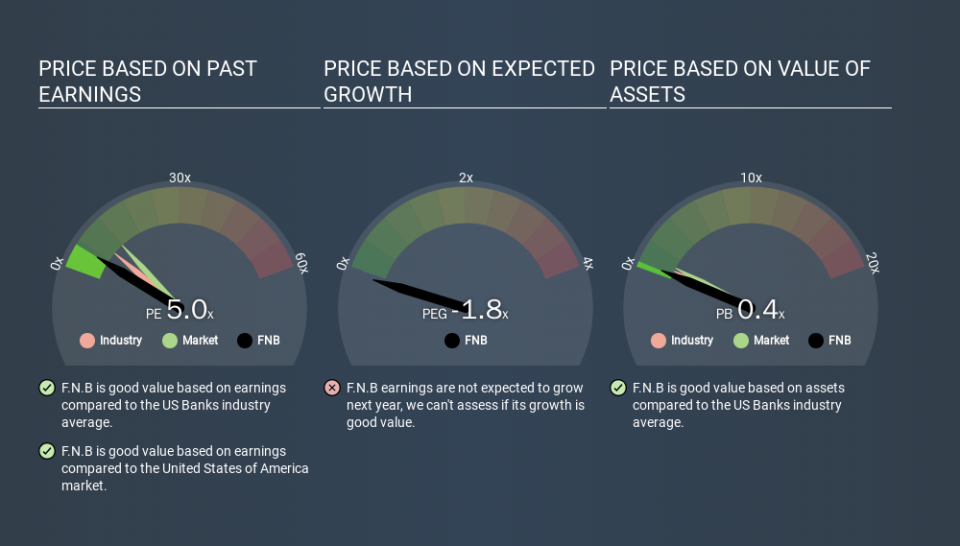
F.N.B's P/E tells us that market participants think it will not fare as well as its peers in the same industry. Many investors like to buy stocks when the market is pessimistic about their prospects. It is arguably worth checking if insiders are buying shares, because that might imply they believe the stock is undervalued.
How Growth Rates Impact P/E Ratios
Generally speaking the rate of earnings growth has a profound impact on a company's P/E multiple. When earnings grow, the 'E' increases, over time. That means unless the share price increases, the P/E will reduce in a few years. And as that P/E ratio drops, the company will look cheap, unless its share price increases.
F.N.B saw earnings per share improve by 3.6% last year. And it has bolstered its earnings per share by 7.5% per year over the last five years.
Remember: P/E Ratios Don't Consider The Balance Sheet
Don't forget that the P/E ratio considers market capitalization. So it won't reflect the advantage of cash, or disadvantage of debt. Hypothetically, a company could reduce its future P/E ratio by spending its cash (or taking on debt) to achieve higher earnings.
Such expenditure might be good or bad, in the long term, but the point here is that the balance sheet is not reflected by this ratio.
So What Does F.N.B's Balance Sheet Tell Us?
F.N.B has net debt worth a very significant 175% of its market capitalization. If you want to compare its P/E ratio to other companies, you must keep in mind that these debt levels would usually warrant a relatively low P/E.
The Verdict On F.N.B's P/E Ratio
F.N.B trades on a P/E ratio of 5.0, which is below the US market average of 11.5. While the recent EPS growth is a positive, the significant amount of debt on the balance sheet may be contributing to pessimistic market expectations. What can be absolutely certain is that the market has become more pessimistic about F.N.B over the last month, with the P/E ratio falling from 10.1 back then to 5.0 today. For those who prefer to invest with the flow of momentum, that might be a bad sign, but for deep value investors this stock might justify some research.
Investors should be looking to buy stocks that the market is wrong about. As value investor Benjamin Graham famously said, 'In the short run, the market is a voting machine but in the long run, it is a weighing machine. So this free visualization of the analyst consensus on future earnings could help you make the right decision about whether to buy, sell, or hold.
But note: F.N.B may not be the best stock to buy. So take a peek at this free list of interesting companies with strong recent earnings growth (and a P/E ratio below 20).
If you spot an error that warrants correction, please contact the editor at editorial-team@simplywallst.com. This article by Simply Wall St is general in nature. It does not constitute a recommendation to buy or sell any stock, and does not take account of your objectives, or your financial situation. Simply Wall St has no position in the stocks mentioned.
We aim to bring you long-term focused research analysis driven by fundamental data. Note that our analysis may not factor in the latest price-sensitive company announcements or qualitative material. Thank you for reading.
