F5 (FFIV) Surpasses Earnings and Revenue Estimates in Q4
F5, Inc. FFIV reported better-than-expected fourth-quarter fiscal 2023 results. This Seattle, WA-based company’s non-GAAP earnings of $3.50 per share beat the Zacks Consensus Estimate of $3.22 and increased 33.6% from the year-ago quarter’s $2.62 per share.
The bottom line was also way higher than management’s guided range of $3.15-$3.27 per share. The robust bottom-line performance reflects the combined impact of gross margin improvement and disciplined operating expense management.
F5 revenues of $707 million for the fourth quarter surpassed the consensus mark of $701.6 million. Moreover, on a year-over-year basis, revenues increased 1% and came toward the high end of management’s guidance range of $690-$710 million despite persistent macroeconomic uncertainties and tight budgets of customers.
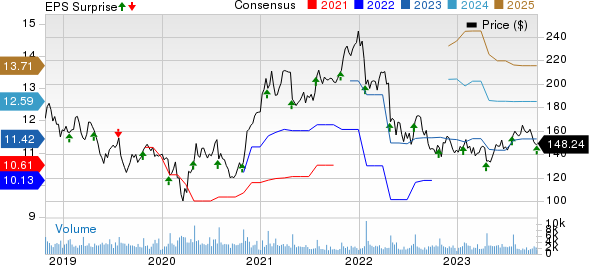
F5, Inc. Price, Consensus and EPS Surprise
F5, Inc. price-consensus-eps-surprise-chart | F5, Inc. Quote
Top Line in Detail
Product revenues (46% of total revenues), which comprise the Software and Systems sub-divisions, decreased 7% year over year to $325 million. The decline in Product revenues was mainly due to lower Systems sales, partially offset by increased Software sales. The company’s reported non-GAAP Product revenues were slightly higher than our estimates of $324.4 million.
Systems revenues plunged 25% year over year to $134 million, accounting for approximately 41% of the total Product revenues. The company revealed that the decline reflects a lower level of backlog-related shipments compared to prior quarters, while the demand shows some signs of stabilization. Our estimates for Systems revenues were pegged at $152.6 million.
However, the negative impacts of lower Systems sales were offset by the strong performance of Software. Software revenues soared 11% year over year to $191 million in the fourth quarter. Our estimates for Software’s fourth-quarter revenues were pegged at $171.7 million.
Global Service revenues (54% of the total revenues) grew 9% to $382 million. The robust growth was mainly driven by price increases introduced last year and the benefits of high-maintenance renewals. Our estimates for Global Services revenues were pegged at $376.5 million.
F5 Networks registered sales growth across the EMEA and APAC regions, witnessing a year-over-year increase of 16% and 4%, respectively. However, revenues from the Americas region fell 6% on a year-over-year basis. Revenue contributions from the Americas, EMEA and APAC regions were 57%, 26% and 17%, respectively.
Customer-wise, Enterprises, Service providers and Government represented 72%, 9% and 19% of product bookings, respectively.
Margins
On a year-over-year basis, GAAP and non-GAAP gross margins expanded 120 basis points (bps) and 130 bps to 80.1% and 82.7%, respectively. We believe that the improvement could be primarily driven by price realization and ease in supply-chain constraints, as well as reductions in ancillary supply-chain costs.
The company’s fourth-quarter GAAP operating expenses went down 11.4% to $394.3 million, while non-GAAP operating expenses declined 9% to $344.8 million. GAAP operating expenses as a percentage of revenues decreased to 55.8% in the fourth quarter of fiscal 2023 from 63.6% in the year-ago quarter. Meanwhile, non-GAAP operating expenses as a percentage of revenues declined to 48.8% from 54.1% in the year-ago quarter.
F5 Networks’ GAAP operating profit jumped 59.3% to $172 million, while the margin expanded 890 bps to 24.3%. Moreover, the non-GAAP operating profit jumped 25.7% year over year to $240 million, while the margin improved 660 bps to 33.9%. An increase in the non-GAAP operating margin was primarily driven by an improvement in the gross margin and lower operating expenses as a percentage of revenues.
Balance Sheet & Cash Flow
F5 Networks exited the September-ended quarter with cash and short-term investments of $808 million compared with the previous quarter’s $690.6 million.
The company generated operating cash flow of $190 million in the fourth quarter and $653.4 million in the full fiscal 2023.
During the quarter, FFIV repurchased shares worth $60 million. In fiscal 2023, it bought back common stocks worth $350 million. As of Sep 30, 2023, F5 had $922 million remaining under its current authorized share repurchase program. Year to date, the company has utilized about 58% of its free cash flow for share buybacks compared with its commitment of using at least 50% of free cash flow for share buybacks announced at the beginning of fiscal 2023.
Guidance
F5 Networks projects non-GAAP revenues in the $675-$695 million band (midpoint of $685 million) and non-GAAP earnings per share in the $2.97-$3.09 band (midpoint of $3.03) for the first quarter of fiscal 2024. The non-GAAP gross margin is forecast between 82% and 83%.
The company expects first-quarter non-GAAP operating expenses between $332 million and $344 million. Share-based compensation expenses are anticipated in the range of $58-$60 million.
For fiscal 2024, F5 forecasts revenues to be flat to a low-single-digit-percentage decline range. Non-GAAP gross and operating margins are anticipated in the ranges of 82-83% and 33-34%, respectively. The effective tax rate for fiscal 2024 is projected in the 21%-23% band.
The company forecasts non-GAAP earnings per share to increase 5-7% in fiscal 2024. Moreover, it intends to return at least 50% of its fiscal 2024 free cash flow to shareholders through share buybacks.
Zacks Rank & Stocks to Consider
F5 currently carries a Zacks Rank #3 (Hold). Shares of FFIV have risen 3.3% year to date (YTD).
Some better-ranked stocks from the broader technology sector are Palo Alto Networks PANW, Salesforce CRM and Fortinet FTNT. Palo Alto sports a Zacks Rank #1 (Strong Buy), while Salesforce and Fortinet each carry a Zacks Rank #2 (Buy) at present. You can see the complete list of today's Zacks #1 Rank stocks here.
The Zacks Consensus Estimate for Palo Alto Networks' first-quarter fiscal 2024 earnings has been revised upward by a penny to $1.16 per share in the past 60 days. For fiscal 2024, earnings estimates have increased by 4 cents to $5.34 per share in the past 60 days.
Palo Alto Networks’ earnings beat the Zacks Consensus Estimate in the preceding four quarters, the average surprise being 22.2%. Shares of PANW have surged 80.7% YTD.
The Zacks Consensus Estimate for Salesforce’s third-quarter fiscal 2024 earnings has been revised 23 cents northward to $2.06 per share in the past 60 days. For fiscal 2024, earnings estimates have moved 8.3% upward to $8.06 per share in the past 60 days.
Salesforce’s earnings beat the Zacks Consensus Estimate in the preceding four quarters, the average surprise being 14.2%. Shares of CRM have risen 54% YTD.
The Zacks Consensus Estimate for Fortinet's third-quarter 2023 earnings has remained unchanged at 37 cents per share in the past 60 days. For 2023, earnings estimates have remained stagnant at $1.51 per share in the past 60 days.
Fortinet’s earnings beat the Zacks Consensus Estimate in the preceding four quarters, the average surprise being 17.1%. Shares of FTNT have risen 17.7% YTD.
Want the latest recommendations from Zacks Investment Research? Today, you can download 7 Best Stocks for the Next 30 Days. Click to get this free report
Salesforce Inc. (CRM) : Free Stock Analysis Report
F5, Inc. (FFIV) : Free Stock Analysis Report
Fortinet, Inc. (FTNT) : Free Stock Analysis Report
Palo Alto Networks, Inc. (PANW) : Free Stock Analysis Report
