Is Fabrinet’s (FN) 15.71% ROE Good Enough Compared To Its Industry?

Fabrinet (NYSE:FN) outperformed the Electronic Manufacturing Services industry on the basis of its ROE – producing a higher 15.71% relative to the peer average of 10.88% over the past 12 months. On the surface, this looks fantastic since we know that FN has made large profits from little equity capital; however, ROE doesn’t tell us if management have borrowed heavily to make this happen. We’ll take a closer look today at factors like financial leverage to determine whether FN’s ROE is actually sustainable. View our latest analysis for Fabrinet
What you must know about ROE
Return on Equity (ROE) weighs FN’s profit against the level of its shareholders’ equity. An ROE of 15.71% implies $0.16 returned on every $1 invested. In most cases, a higher ROE is preferred; however, there are many other factors we must consider prior to making any investment decisions.
Return on Equity = Net Profit ÷ Shareholders Equity
ROE is measured against cost of equity in order to determine the efficiency of FN’s equity capital deployed. Its cost of equity is 10.05%. Given a positive discrepancy of 5.67% between return and cost, this indicates that FN pays less for its capital than what it generates in return, which is a sign of capital efficiency. ROE can be split up into three useful ratios: net profit margin, asset turnover, and financial leverage. This is called the Dupont Formula:
Dupont Formula
ROE = profit margin × asset turnover × financial leverage
ROE = (annual net profit ÷ sales) × (sales ÷ assets) × (assets ÷ shareholders’ equity)
ROE = annual net profit ÷ shareholders’ equity
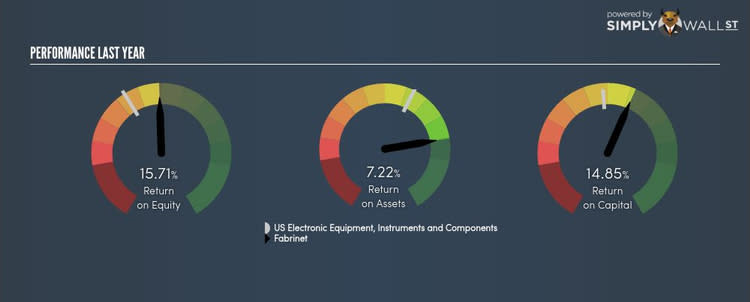
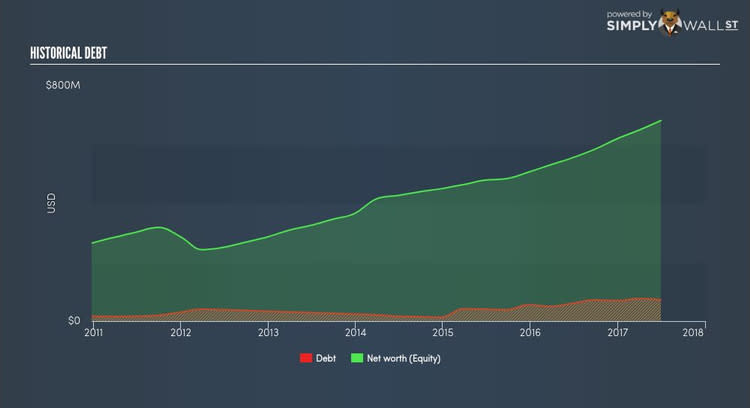
Basically, profit margin measures how much of revenue trickles down into earnings which illustrates how efficient FN is with its cost management. Asset turnover reveals how much revenue can be generated from FN’s asset base. And finally, financial leverage is simply how much of assets are funded by equity, which exhibits how sustainable FN’s capital structure is. Since financial leverage can artificially inflate ROE, we need to look at how much debt FN currently has. The debt-to-equity ratio currently stands at a low 10.63%, meaning the above-average ROE is due to its capacity to produce profit growth without a huge debt burden.
What this means for you:
Are you a shareholder? FN’s ROE is impressive relative to the industry average and also covers its cost of equity. Since ROE is not inflated by excessive debt, it might be a good time to add more of FN to your portfolio if your personal research is confirming what the ROE is telling you.
Are you a potential investor? If FN has been on your watch list for a while, making an investment decision based on ROE alone is unwise. I recommend you do additional fundamental analysis by looking through our most recent infographic report on Fabrinet to help you make a more informed investment decision. If you are not interested in FN anymore, you can use our free platform to see our list of stocks with Return on Equity over 20%.
To help readers see pass the short term volatility of the financial market, we aim to bring you a long-term focused research analysis purely driven by fundamental data. Note that our analysis does not factor in the latest price sensitive company announcements.
The author is an independent contributor and at the time of publication had no position in the stocks mentioned.
