Facebook Shares Gain Friday: Technical Levels To Watch

Facebook Inc. (NASDAQ: FB) shares were trading higher Friday.
The stock is trending on StockTwits.
Facebook reportedly plans on creating an app similar to Instagram for kids under the age of 13.
Facebook shares were up 4% at $289.77 at last check.
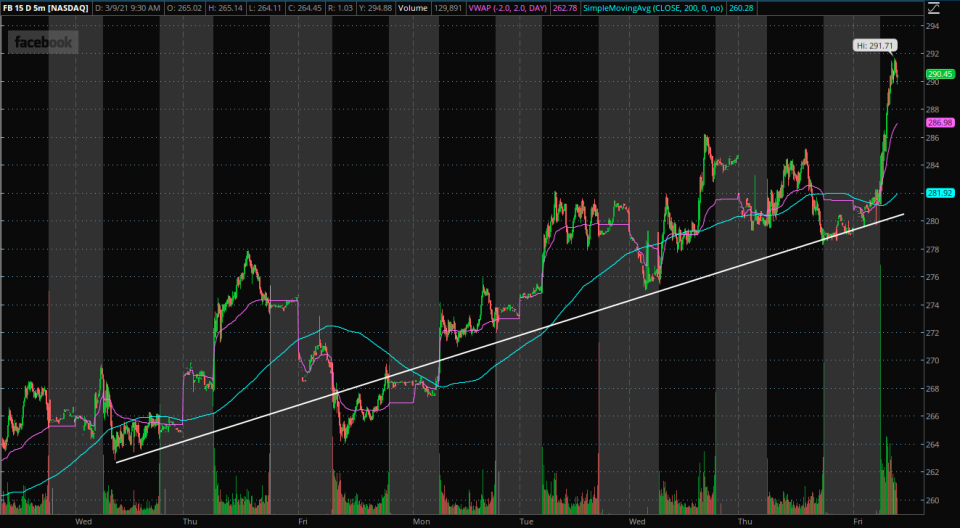
Facebook Short-Term Chart Analysis: The 5-minute chart above shows that Facebook stock has been building higher lows throughout the last two weeks. These lows can be connected with a trendline that shows possible future technical support.
The stock may find short-term resistance near the high of the day near $292.
The stock is trading above both the 200-day moving average (blue) as well as the volume-weighted average price (pink). This gives the stock a bullish short-term sentiment, and these indicators may hold as support in the near future.
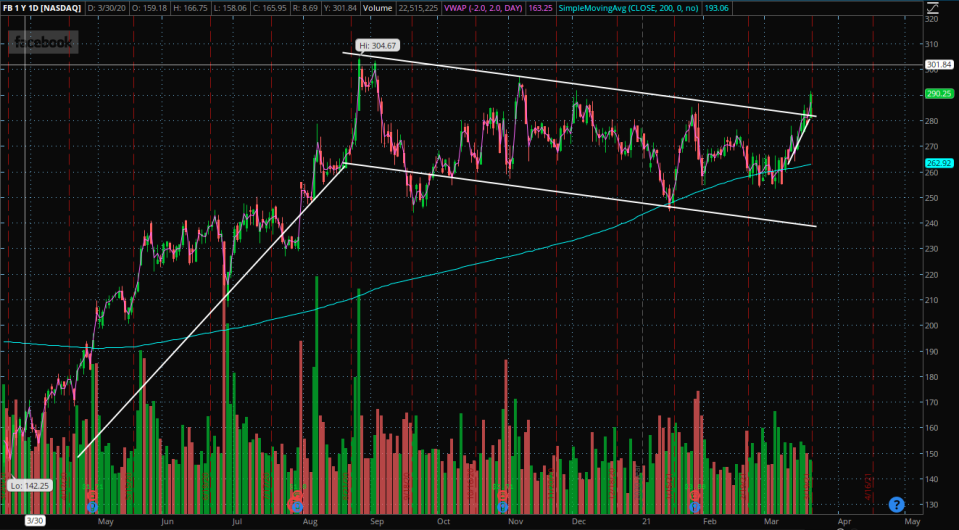
Facebook Daily Chart Analysis: The daily chart above on Facebook seems to be forming what technical traders call a “bullish flag” pattern.
The bullish flag pattern occurs after the stock makes a bullish run and consolidates in a sideways channel before resistance is broken again and the stock makes its next leg up.
Although “bullish” is in the name, the patterns may not follow what the name implies 100% of the time. Traders need to take caution and make their own informed trading decisions when trying to trade a technical pattern.
See more from Benzinga
© 2021 Benzinga.com. Benzinga does not provide investment advice. All rights reserved.
