Factors Income Investors Should Consider Before Adding The Star Entertainment Group Limited (ASX:SGR) To Their Portfolio

Today we'll take a closer look at The Star Entertainment Group Limited (ASX:SGR) from a dividend investor's perspective. Owning a strong business and reinvesting the dividends is widely seen as an attractive way of growing your wealth. On the other hand, investors have been known to buy a stock because of its yield, and then lose money if the company's dividend doesn't live up to expectations.
With a eight-year payment history and a 5.1% yield, many investors probably find Star Entertainment Group intriguing. It sure looks interesting on these metrics - but there's always more to the story . There are a few simple ways to reduce the risks of buying Star Entertainment Group for its dividend, and we'll go through these below.
Click the interactive chart for our full dividend analysis
Payout ratios
Dividends are usually paid out of company earnings. If a company is paying more than it earns, then the dividend might become unsustainable - hardly an ideal situation. As a result, we should always investigate whether a company can afford its dividend, measured as a percentage of a company's net income after tax. Looking at the data, we can see that 150% of Star Entertainment Group's profits were paid out as dividends in the last 12 months. A payout ratio above 100% is definitely an item of concern, unless there are some other circumstances that would justify it.
We also measure dividends paid against a company's levered free cash flow, to see if enough cash was generated to cover the dividend. Star Entertainment Group paid out 1006% of its free cash flow last year, suggesting the dividend is poorly covered by cash flow. Paying out more than 100% of your free cash flow in dividends is generally not a long-term, sustainable state of affairs, so we think shareholders should watch this metric closely. Cash is slightly more important than profit from a dividend perspective, but given Star Entertainment Group's payments were not well covered by either earnings or cash flow, we are concerned about the sustainability of this dividend.
Is Star Entertainment Group's Balance Sheet Risky?
As Star Entertainment Group's dividend was not well covered by earnings, we need to check its balance sheet for signs of financial distress. A rough way to check this is with these two simple ratios: a) net debt divided by EBITDA (earnings before interest, tax, depreciation and amortisation), and b) net interest cover. Net debt to EBITDA is a measure of a company's total debt. Net interest cover measures the ability to meet interest payments. Essentially we check that a) the company does not have too much debt, and b) that it can afford to pay the interest. Star Entertainment Group has net debt of 3.23 times its EBITDA, which is getting towards the limit of most investors' comfort zones. Judicious use of debt can enhance shareholder returns, but also adds to the risk if something goes awry.
Net interest cover can be calculated by dividing earnings before interest and tax (EBIT) by the company's net interest expense. Net interest cover of 5.24 times its interest expense appears reasonable for Star Entertainment Group, although we're conscious that even high interest cover doesn't make a company bulletproof.
Consider getting our latest analysis on Star Entertainment Group's financial position here.
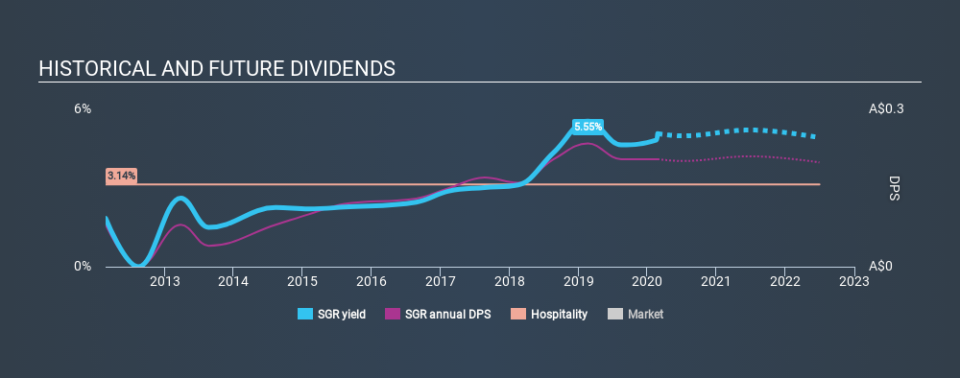
Dividend Volatility
From the perspective of an income investor who wants to earn dividends for many years, there is not much point buying a stock if its dividend is regularly cut or is not reliable. Looking at the last decade of data, we can see that Star Entertainment Group paid its first dividend at least eight years ago. Although it has been paying a dividend for several years now, the dividend has been cut at least once, and we're cautious about the consistency of its dividend across a full economic cycle. During the past eight-year period, the first annual payment was AU$0.08 in 2012, compared to AU$0.20 last year. Dividends per share have grown at approximately 12% per year over this time. The growth in dividends has not been linear, but the CAGR is a decent approximation of the rate of change over this time frame.
Star Entertainment Group has grown distributions at a rapid rate despite cutting the dividend at least once in the past. Companies that cut once often cut again, but it might be worth considering if the business has turned a corner.
Dividend Growth Potential
Given that the dividend has been cut in the past, we need to check if earnings are growing and if that might lead to stronger dividends in the future. Star Entertainment Group's EPS are effectively flat over the past five years. Over the long term, steady earnings per share is a risk as the value of the dividends can be reduced by inflation. This level of earnings growth is low, and the company is paying out 150% of its profit. Limited recent earnings growth and a high payout ratio makes it hard for us to envision strong future dividend growth, unless the company should have substantial pricing power or some form of competitive advantage.
Conclusion
To summarise, shareholders should always check that Star Entertainment Group's dividends are affordable, that its dividend payments are relatively stable, and that it has decent prospects for growing its earnings and dividend. Star Entertainment Group paid out almost all of its cash flow and profit as dividends, leaving little to reinvest in the business. Second, earnings have been essentially flat, and its history of dividend payments is chequered - having cut its dividend at least once in the past. In this analysis, Star Entertainment Group doesn't shape up too well as a dividend stock. We'd find it hard to look past the flaws, and would not be inclined to think of it as a reliable dividend-payer.
Earnings growth generally bodes well for the future value of company dividend payments. See if the 11 Star Entertainment Group analysts we track are forecasting continued growth with our free report on analyst estimates for the company.
If you are a dividend investor, you might also want to look at our curated list of dividend stocks yielding above 3%.
If you spot an error that warrants correction, please contact the editor at editorial-team@simplywallst.com. This article by Simply Wall St is general in nature. It does not constitute a recommendation to buy or sell any stock, and does not take account of your objectives, or your financial situation. Simply Wall St has no position in the stocks mentioned.
We aim to bring you long-term focused research analysis driven by fundamental data. Note that our analysis may not factor in the latest price-sensitive company announcements or qualitative material. Thank you for reading.
