A fantastic week for DMC Global Inc.'s (NASDAQ:BOOM) 79% institutional owners, one-year returns continue to impress
Key Insights
Institutions' substantial holdings in DMC Global implies that they have significant influence over the company's share price
A total of 12 investors have a majority stake in the company with 51% ownership
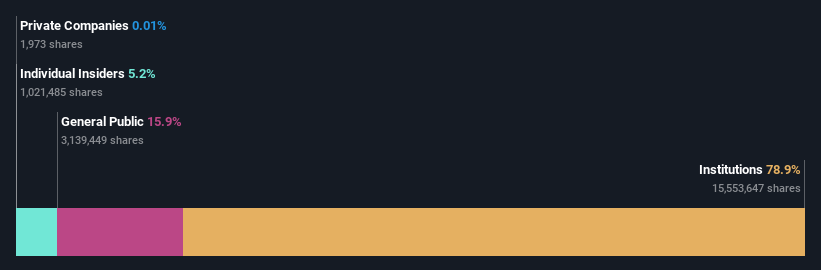
To get a sense of who is truly in control of DMC Global Inc. (NASDAQ:BOOM), it is important to understand the ownership structure of the business. The group holding the most number of shares in the company, around 79% to be precise, is institutions. Put another way, the group faces the maximum upside potential (or downside risk).
And as as result, institutional investors reaped the most rewards after the company's stock price gained 13% last week. The one-year return on investment is currently 2.1% and last week's gain would have been more than welcomed.
Let's take a closer look to see what the different types of shareholders can tell us about DMC Global.
View our latest analysis for DMC Global
What Does The Institutional Ownership Tell Us About DMC Global?
Many institutions measure their performance against an index that approximates the local market. So they usually pay more attention to companies that are included in major indices.
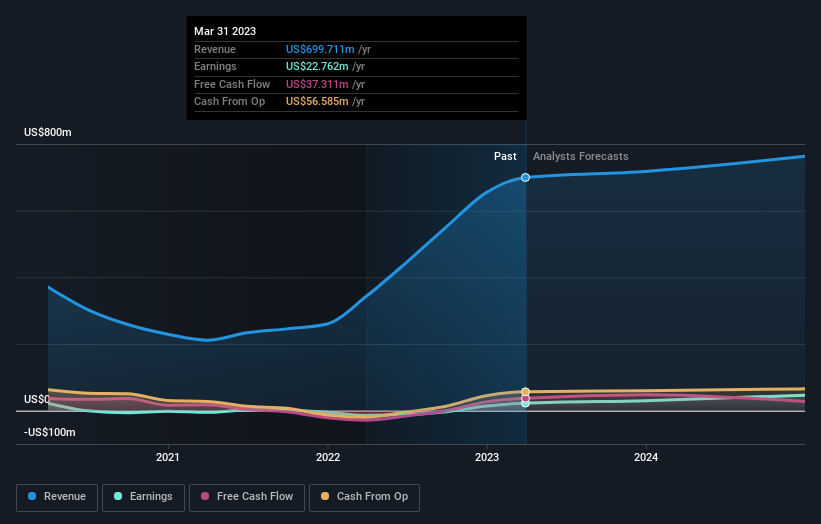
DMC Global already has institutions on the share registry. Indeed, they own a respectable stake in the company. This implies the analysts working for those institutions have looked at the stock and they like it. But just like anyone else, they could be wrong. When multiple institutions own a stock, there's always a risk that they are in a 'crowded trade'. When such a trade goes wrong, multiple parties may compete to sell stock fast. This risk is higher in a company without a history of growth. You can see DMC Global's historic earnings and revenue below, but keep in mind there's always more to the story.
Institutional investors own over 50% of the company, so together than can probably strongly influence board decisions. Hedge funds don't have many shares in DMC Global. Cooke & Bieler, L.P. is currently the largest shareholder, with 8.3% of shares outstanding. With 8.3% and 7.3% of the shares outstanding respectively, BlackRock, Inc. and EARNEST Partners, LLC are the second and third largest shareholders.
A closer look at our ownership figures suggests that the top 12 shareholders have a combined ownership of 51% implying that no single shareholder has a majority.
While it makes sense to study institutional ownership data for a company, it also makes sense to study analyst sentiments to know which way the wind is blowing. There are a reasonable number of analysts covering the stock, so it might be useful to find out their aggregate view on the future.
Insider Ownership Of DMC Global
The definition of an insider can differ slightly between different countries, but members of the board of directors always count. Company management run the business, but the CEO will answer to the board, even if he or she is a member of it.
Most consider insider ownership a positive because it can indicate the board is well aligned with other shareholders. However, on some occasions too much power is concentrated within this group.
Shareholders would probably be interested to learn that insiders own shares in DMC Global Inc.. As individuals, the insiders collectively own US$18m worth of the US$351m company. It is good to see some investment by insiders, but it might be worth checking if those insiders have been buying.
General Public Ownership
With a 16% ownership, the general public, mostly comprising of individual investors, have some degree of sway over DMC Global. While this group can't necessarily call the shots, it can certainly have a real influence on how the company is run.
Next Steps:
While it is well worth considering the different groups that own a company, there are other factors that are even more important.
I always like to check for a history of revenue growth. You can too, by accessing this free chart of historic revenue and earnings in this detailed graph.
If you would prefer discover what analysts are predicting in terms of future growth, do not miss this free report on analyst forecasts.
NB: Figures in this article are calculated using data from the last twelve months, which refer to the 12-month period ending on the last date of the month the financial statement is dated. This may not be consistent with full year annual report figures.
Have feedback on this article? Concerned about the content? Get in touch with us directly. Alternatively, email editorial-team (at) simplywallst.com.
This article by Simply Wall St is general in nature. We provide commentary based on historical data and analyst forecasts only using an unbiased methodology and our articles are not intended to be financial advice. It does not constitute a recommendation to buy or sell any stock, and does not take account of your objectives, or your financial situation. We aim to bring you long-term focused analysis driven by fundamental data. Note that our analysis may not factor in the latest price-sensitive company announcements or qualitative material. Simply Wall St has no position in any stocks mentioned.
Join A Paid User Research Session
You’ll receive a US$30 Amazon Gift card for 1 hour of your time while helping us build better investing tools for the individual investors like yourself. Sign up here
