Far East Orchard (SGX:O10) shareholders have endured a 1.9% loss from investing in the stock five years ago
The legendary Jack Bogle helped popularize passive investing, which allows investors to match market returns. You can get far superior returns with a well chosen portfolio of stocks, but some stocks are going to fall short. Shareholders of Far East Orchard Limited (SGX:O10) have lost -20% in the last five years, falling short of the market decline of around 1.8%.
Now let's have a look at the company's fundamentals, and see if the long term shareholder return has matched the performance of the underlying business.
View our latest analysis for Far East Orchard
To quote Buffett, 'Ships will sail around the world but the Flat Earth Society will flourish. There will continue to be wide discrepancies between price and value in the marketplace...' One imperfect but simple way to consider how the market perception of a company has shifted is to compare the change in the earnings per share (EPS) with the share price movement.
Looking back five years, both Far East Orchard's share price and EPS declined; the latter at a rate of 4.6% per year. This change in EPS is reasonably close to the 4% average annual decrease in the share price. This implies that the market has had a fairly steady view of the stock. Rather, the share price change has reflected changes in earnings per share.
You can see how EPS has changed over time in the image below (click on the chart to see the exact values).
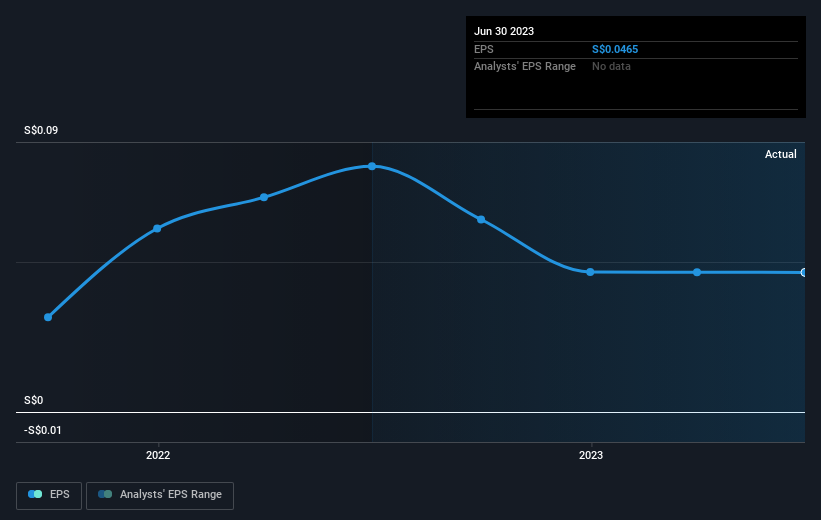
Dive deeper into Far East Orchard's key metrics by checking this interactive graph of Far East Orchard's earnings, revenue and cash flow.
What About Dividends?
As well as measuring the share price return, investors should also consider the total shareholder return (TSR). The TSR is a return calculation that accounts for the value of cash dividends (assuming that any dividend received was reinvested) and the calculated value of any discounted capital raisings and spin-offs. Arguably, the TSR gives a more comprehensive picture of the return generated by a stock. We note that for Far East Orchard the TSR over the last 5 years was -1.9%, which is better than the share price return mentioned above. And there's no prize for guessing that the dividend payments largely explain the divergence!
A Different Perspective
Far East Orchard provided a TSR of 2.8% over the last twelve months. But that was short of the market average. But at least that's still a gain! Over five years the TSR has been a reduction of 0.4% per year, over five years. So this might be a sign the business has turned its fortunes around. It's always interesting to track share price performance over the longer term. But to understand Far East Orchard better, we need to consider many other factors. For instance, we've identified 5 warning signs for Far East Orchard (1 can't be ignored) that you should be aware of.
We will like Far East Orchard better if we see some big insider buys. While we wait, check out this free list of growing companies with considerable, recent, insider buying.
Please note, the market returns quoted in this article reflect the market weighted average returns of stocks that currently trade on Singaporean exchanges.
Have feedback on this article? Concerned about the content? Get in touch with us directly. Alternatively, email editorial-team (at) simplywallst.com.
This article by Simply Wall St is general in nature. We provide commentary based on historical data and analyst forecasts only using an unbiased methodology and our articles are not intended to be financial advice. It does not constitute a recommendation to buy or sell any stock, and does not take account of your objectives, or your financial situation. We aim to bring you long-term focused analysis driven by fundamental data. Note that our analysis may not factor in the latest price-sensitive company announcements or qualitative material. Simply Wall St has no position in any stocks mentioned.
