FDM Group (Holdings) (LON:FDM) investors are sitting on a loss of 53% if they invested three years ago
FDM Group (Holdings) plc (LON:FDM) shareholders should be happy to see the share price up 17% in the last month. Meanwhile over the last three years the stock has dropped hard. Indeed, the share price is down a tragic 59% in the last three years. So it's good to see it climbing back up. The rise has some hopeful, but turnarounds are often precarious.
Now let's have a look at the company's fundamentals, and see if the long term shareholder return has matched the performance of the underlying business.
See our latest analysis for FDM Group (Holdings)
To paraphrase Benjamin Graham: Over the short term the market is a voting machine, but over the long term it's a weighing machine. One flawed but reasonable way to assess how sentiment around a company has changed is to compare the earnings per share (EPS) with the share price.
Although the share price is down over three years, FDM Group (Holdings) actually managed to grow EPS by 1.5% per year in that time. Given the share price reaction, one might suspect that EPS is not a good guide to the business performance during the period (perhaps due to a one-off loss or gain). Or else the company was over-hyped in the past, and so its growth has disappointed.
It looks to us like the market was probably too optimistic around growth three years ago. However, taking a look at other business metrics might shed a bit more light on the share price action.
We note that the dividend has declined - a likely contributor to the share price drop. It doesn't seem like the changes in revenue would have impacted the share price much, but a closer inspection of the data might reveal something.
The company's revenue and earnings (over time) are depicted in the image below (click to see the exact numbers).
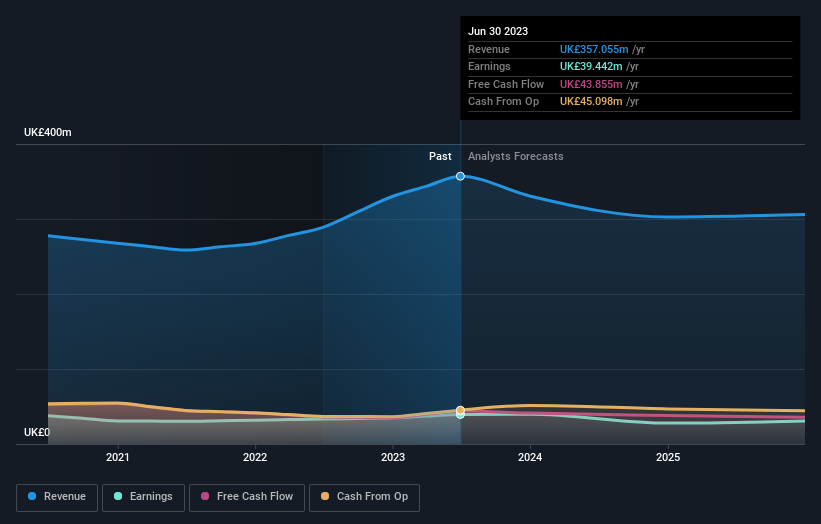
We know that FDM Group (Holdings) has improved its bottom line lately, but what does the future have in store? You can see what analysts are predicting for FDM Group (Holdings) in this interactive graph of future profit estimates.
What About Dividends?
It is important to consider the total shareholder return, as well as the share price return, for any given stock. The TSR incorporates the value of any spin-offs or discounted capital raisings, along with any dividends, based on the assumption that the dividends are reinvested. So for companies that pay a generous dividend, the TSR is often a lot higher than the share price return. In the case of FDM Group (Holdings), it has a TSR of -53% for the last 3 years. That exceeds its share price return that we previously mentioned. And there's no prize for guessing that the dividend payments largely explain the divergence!
A Different Perspective
FDM Group (Holdings) shareholders are down 35% for the year (even including dividends), but the market itself is up 4.3%. However, keep in mind that even the best stocks will sometimes underperform the market over a twelve month period. Regrettably, last year's performance caps off a bad run, with the shareholders facing a total loss of 5% per year over five years. We realise that Baron Rothschild has said investors should "buy when there is blood on the streets", but we caution that investors should first be sure they are buying a high quality business. While it is well worth considering the different impacts that market conditions can have on the share price, there are other factors that are even more important. Take risks, for example - FDM Group (Holdings) has 2 warning signs (and 1 which makes us a bit uncomfortable) we think you should know about.
We will like FDM Group (Holdings) better if we see some big insider buys. While we wait, check out this free list of growing companies with considerable, recent, insider buying.
Please note, the market returns quoted in this article reflect the market weighted average returns of stocks that currently trade on British exchanges.
Have feedback on this article? Concerned about the content? Get in touch with us directly. Alternatively, email editorial-team (at) simplywallst.com.
This article by Simply Wall St is general in nature. We provide commentary based on historical data and analyst forecasts only using an unbiased methodology and our articles are not intended to be financial advice. It does not constitute a recommendation to buy or sell any stock, and does not take account of your objectives, or your financial situation. We aim to bring you long-term focused analysis driven by fundamental data. Note that our analysis may not factor in the latest price-sensitive company announcements or qualitative material. Simply Wall St has no position in any stocks mentioned.
