FFI Holdings Limited's (ASX:FFI) Fundamentals Look Pretty Strong: Could The Market Be Wrong About The Stock?
FFI Holdings (ASX:FFI) has had a rough three months with its share price down 14%. However, stock prices are usually driven by a company’s financials over the long term, which in this case look pretty respectable. Specifically, we decided to study FFI Holdings' ROE in this article.
Return on equity or ROE is an important factor to be considered by a shareholder because it tells them how effectively their capital is being reinvested. Simply put, it is used to assess the profitability of a company in relation to its equity capital.
Check out our latest analysis for FFI Holdings
How Do You Calculate Return On Equity?
ROE can be calculated by using the formula:
Return on Equity = Net Profit (from continuing operations) ÷ Shareholders' Equity
So, based on the above formula, the ROE for FFI Holdings is:
1.1% = AU$490k ÷ AU$43m (Based on the trailing twelve months to December 2022).
The 'return' is the amount earned after tax over the last twelve months. That means that for every A$1 worth of shareholders' equity, the company generated A$0.01 in profit.
What Is The Relationship Between ROE And Earnings Growth?
Thus far, we have learned that ROE measures how efficiently a company is generating its profits. Based on how much of its profits the company chooses to reinvest or "retain", we are then able to evaluate a company's future ability to generate profits. Assuming everything else remains unchanged, the higher the ROE and profit retention, the higher the growth rate of a company compared to companies that don't necessarily bear these characteristics.
FFI Holdings' Earnings Growth And 1.1% ROE
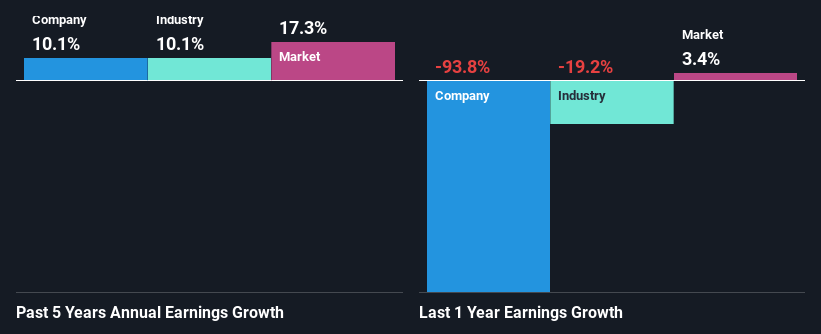
It is hard to argue that FFI Holdings' ROE is much good in and of itself. Even compared to the average industry ROE of 7.0%, the company's ROE is quite dismal. However, the moderate 10% net income growth seen by FFI Holdings over the past five years is definitely a positive. We reckon that there could be other factors at play here. For instance, the company has a low payout ratio or is being managed efficiently.
We then performed a comparison between FFI Holdings' net income growth with the industry, which revealed that the company's growth is similar to the average industry growth of 10% in the same period.
Earnings growth is an important metric to consider when valuing a stock. The investor should try to establish if the expected growth or decline in earnings, whichever the case may be, is priced in. By doing so, they will have an idea if the stock is headed into clear blue waters or if swampy waters await. If you're wondering about FFI Holdings''s valuation, check out this gauge of its price-to-earnings ratio, as compared to its industry.
Is FFI Holdings Efficiently Re-investing Its Profits?
While the company did pay out a portion of its dividend in the past, it currently doesn't pay a dividend. We infer that the company has been reinvesting all of its profits to grow its business.
Summary
In total, it does look like FFI Holdings has some positive aspects to its business. With a high rate of reinvestment, albeit at a low ROE, the company has managed to see a considerable growth in its earnings. Until now, we have only just grazed the surface of the company's past performance by looking at the company's fundamentals. You can do your own research on FFI Holdings and see how it has performed in the past by looking at this FREE detailed graph of past earnings, revenue and cash flows.
Have feedback on this article? Concerned about the content? Get in touch with us directly. Alternatively, email editorial-team (at) simplywallst.com.
This article by Simply Wall St is general in nature. We provide commentary based on historical data and analyst forecasts only using an unbiased methodology and our articles are not intended to be financial advice. It does not constitute a recommendation to buy or sell any stock, and does not take account of your objectives, or your financial situation. We aim to bring you long-term focused analysis driven by fundamental data. Note that our analysis may not factor in the latest price-sensitive company announcements or qualitative material. Simply Wall St has no position in any stocks mentioned.
Join A Paid User Research Session
You’ll receive a US$30 Amazon Gift card for 1 hour of your time while helping us build better investing tools for the individual investors like yourself. Sign up here
