Fidelity D & D Bancorp Inc (FDBC): A Comprehensive GF Score Analysis
Fidelity D & D Bancorp Inc (NASDAQ:FDBC), a prominent player in the banking industry, is currently trading at $49.05 with a market capitalization of $277.881 million. As of July 24, 2023, the company's stock has seen a gain of 3.15% today, despite a slight loss of -0.16% over the past four weeks. This article will delve into the company's GF Score and its various components to provide a comprehensive analysis of its financial performance and potential.
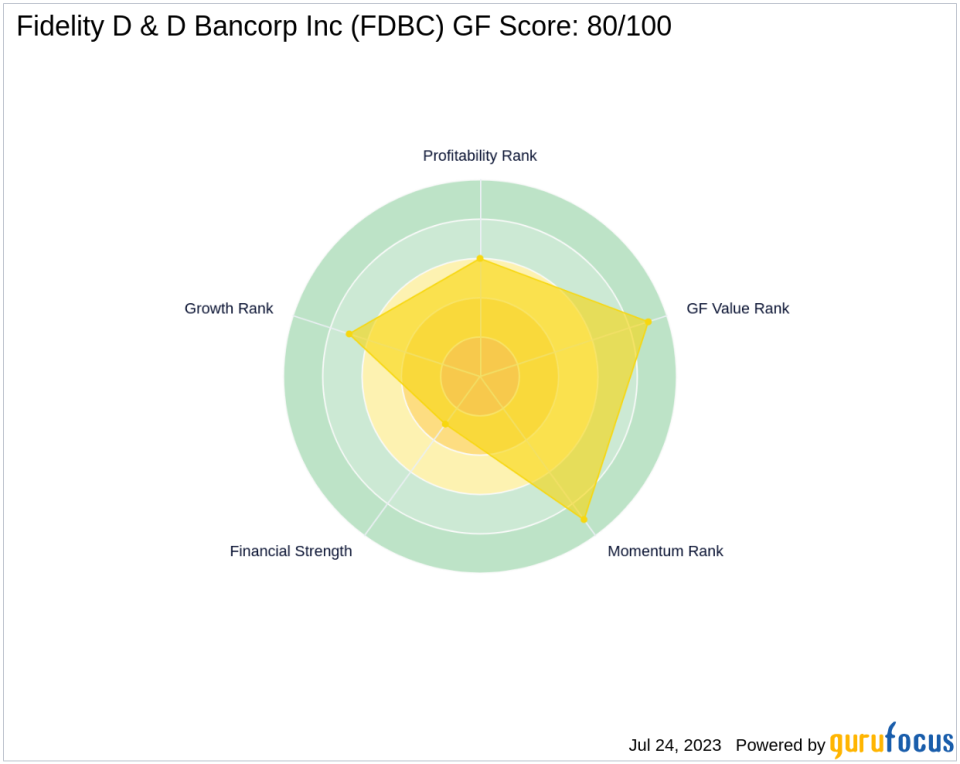
Financial Strength Analysis
The Financial Strength of a company is a crucial indicator of its ability to withstand economic downturns. FDBC's Financial Strength Rank stands at 3/10, which is relatively low. This rank is determined by several factors, including the interest coverage (N/A), debt to revenue ratio (1.22), and the Altman Z score (0.00). The low Financial Strength Rank suggests that FDBC may face challenges in managing its debt and financial obligations.
Profitability Rank Analysis
The Profitability Rank of FDBC is 6/10, indicating a moderate level of profitability. This rank is based on factors such as the Operating Margin (0.00%), Piotroski F-Score (6), and the consistency of profitability over the past 10 years. The company's Profitability Rank suggests that it has been consistently profitable, which is a positive sign for potential investors.
Growth Rank Analysis
FDBC's Growth Rank is 7/10, indicating a relatively high growth rate. This rank is determined by the 5-year revenue growth rate (10.60%) and the 3-year revenue growth rate (12.30%). However, the 5-year EBITDA growth rate is 0.00, which may indicate some challenges in the company's growth strategy.
GF Value Rank Analysis
The GF Value Rank of FDBC is 9/10, suggesting that the stock is undervalued. This rank is based on the price-to-GF-Value ratio, which takes into account historical multiples and an adjustment factor based on past returns and growth, as well as future business performance estimates.
Momentum Rank Analysis
The Momentum Rank of FDBC is 9/10, indicating strong momentum in the company's stock price. This rank is determined by the standardized momentum ratio and other momentum indicators, suggesting that FDBC's stock price has been performing well recently.
Competitor Analysis
When compared to its main competitors in the banking industry, FDBC's GF Score of 80/100 is competitive. Home Bancorp Inc (NASDAQ:HBCP) has a slightly higher GF Score of 82, while Sterling Bancorp Inc (NASDAQ:SBT) and First Bancorp Inc (NASDAQ:FNLC) have lower GF Scores of 49 and 71, respectively.
Conclusion
In conclusion, Fidelity D & D Bancorp Inc (NASDAQ:FDBC) has a strong GF Score of 80/100, indicating good outperformance potential. Despite a low Financial Strength Rank, the company has demonstrated consistent profitability and strong growth. Its high GF Value Rank and Momentum Rank also suggest that the stock is undervalued and has strong momentum. Therefore, FDBC presents a promising investment opportunity based on its GF Score and ranks.
This article first appeared on GuruFocus.
