What Is Fidelity National Financial's (NYSE:FNF) P/E Ratio After Its Share Price Tanked?

Unfortunately for some shareholders, the Fidelity National Financial (NYSE:FNF) share price has dived 46% in the last thirty days. Indeed the recent decline has arguably caused some bitterness for shareholders who have held through the 35% drop over twelve months.
Assuming nothing else has changed, a lower share price makes a stock more attractive to potential buyers. While the market sentiment towards a stock is very changeable, in the long run, the share price will tend to move in the same direction as earnings per share. So, on certain occasions, long term focussed investors try to take advantage of pessimistic expectations to buy shares at a better price. One way to gauge market expectations of a stock is to look at its Price to Earnings Ratio (PE Ratio). A high P/E ratio means that investors have a high expectation about future growth, while a low P/E ratio means they have low expectations about future growth.
See our latest analysis for Fidelity National Financial
How Does Fidelity National Financial's P/E Ratio Compare To Its Peers?
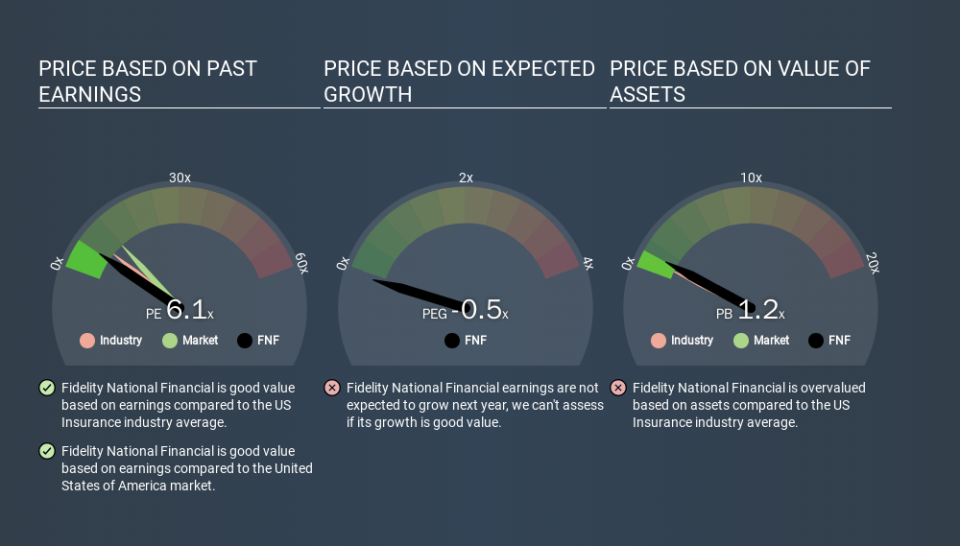
Fidelity National Financial's P/E of 6.09 indicates relatively low sentiment towards the stock. If you look at the image below, you can see Fidelity National Financial has a lower P/E than the average (8.2) in the insurance industry classification.
This suggests that market participants think Fidelity National Financial will underperform other companies in its industry. Many investors like to buy stocks when the market is pessimistic about their prospects. It is arguably worth checking if insiders are buying shares, because that might imply they believe the stock is undervalued.
How Growth Rates Impact P/E Ratios
Probably the most important factor in determining what P/E a company trades on is the earnings growth. If earnings are growing quickly, then the 'E' in the equation will increase faster than it would otherwise. That means unless the share price increases, the P/E will reduce in a few years. Then, a lower P/E should attract more buyers, pushing the share price up.
In the last year, Fidelity National Financial grew EPS like Taylor Swift grew her fan base back in 2010; the 69% gain was both fast and well deserved. And earnings per share have improved by 22% annually, over the last three years. So we'd absolutely expect it to have a relatively high P/E ratio.
A Limitation: P/E Ratios Ignore Debt and Cash In The Bank
It's important to note that the P/E ratio considers the market capitalization, not the enterprise value. Thus, the metric does not reflect cash or debt held by the company. In theory, a company can lower its future P/E ratio by using cash or debt to invest in growth.
While growth expenditure doesn't always pay off, the point is that it is a good option to have; but one that the P/E ratio ignores.
Is Debt Impacting Fidelity National Financial's P/E?
With net cash of US$1.0b, Fidelity National Financial has a very strong balance sheet, which may be important for its business. Having said that, at 16% of its market capitalization the cash hoard would contribute towards a higher P/E ratio.
The Verdict On Fidelity National Financial's P/E Ratio
Fidelity National Financial trades on a P/E ratio of 6.1, which is below the US market average of 12.2. It grew its EPS nicely over the last year, and the healthy balance sheet implies there is more potential for growth. The below average P/E ratio suggests that market participants don't believe the strong growth will continue. What can be absolutely certain is that the market has become more pessimistic about Fidelity National Financial over the last month, with the P/E ratio falling from 11.3 back then to 6.1 today. For those who prefer invest in growth, this stock apparently offers limited promise, but the deep value investors may find the pessimism around this stock enticing.
When the market is wrong about a stock, it gives savvy investors an opportunity. If it is underestimating a company, investors can make money by buying and holding the shares until the market corrects itself. So this free visualization of the analyst consensus on future earnings could help you make the right decision about whether to buy, sell, or hold.
You might be able to find a better buy than Fidelity National Financial. If you want a selection of possible winners, check out this free list of interesting companies that trade on a P/E below 20 (but have proven they can grow earnings).
If you spot an error that warrants correction, please contact the editor at editorial-team@simplywallst.com. This article by Simply Wall St is general in nature. It does not constitute a recommendation to buy or sell any stock, and does not take account of your objectives, or your financial situation. Simply Wall St has no position in the stocks mentioned.
We aim to bring you long-term focused research analysis driven by fundamental data. Note that our analysis may not factor in the latest price-sensitive company announcements or qualitative material. Thank you for reading.
