Fidelity National (FIS) Q4 Earnings Miss on High Interest Costs
Fidelity National Information Services, Inc. FIS reported fourth-quarter 2023 adjusted earnings per share (EPS) of 94 cents, which missed the Zacks Consensus Estimate by 1.1%. The bottom line declined 4% year over year.
Revenues dipped 1% year over year to $2.51 billion. The top line fell short of the consensus mark of $2.52 billion.
The quarterly results were hit by softer revenue contribution from the Banking Solutions segment and a significant rise in interest expenses. Its shares declined 2% in the pre-market trading session due to the weak quarterly results. Nevertheless, higher recurring revenues aided the performance of the Capital Market Solutions business.
Fidelity National Information Services, Inc. Price, Consensus and EPS Surprise
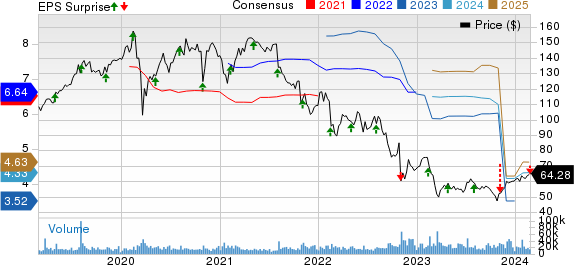
Fidelity National Information Services, Inc. price-consensus-eps-surprise-chart | Fidelity National Information Services, Inc. Quote
Q4 Performance
The cost of revenues was $1.5 billion in the quarter under review, which slipped 2.2% year over year. Selling, general and administrative expenses of Fidelity National tumbled 3.8% year over year to $539 million but were higher than our estimate of $504.4 million. Net interest expenses escalated 41.1% year over year to $158 million but was lower than our estimate of $166.4 million.
Adjusted earnings before interest, tax, depreciation and amortization (EBITDA) inched up 1% year over year to $1.1 billion and beat our estimate of $1 billion. Adjusted EBITDA margin of 42.1% improved 70 basis points (bps) year over year in the fourth quarter.
Segmental Update
Revenues from the Banking Solutions unit remained flat year over year at $1.69 billion, lower than the Zacks Consensus Estimate of $1.72 billion and our estimate of $1.73 billion. Improved adjusted recurring revenues, partly offset by decline in adjusted non-recurring revenues, shaped the segment’s quarterly performance. Adjusted EBITDA was $747 million in the quarter under review, which surpassed the consensus mark of $731 million and our estimate of $740.8 million. Adjusted EBITDA margin of 44.2% improved 270 bps year over year, attributable to cost efficiencies.
The Capital Market Solutions segment recorded revenues of $755 million, which grew 2% year over year in the fourth quarter and beat the Zacks Consensus Estimate of $749 million and our estimate of $743.5 million. Adjusted EBITDA of $402 million outpaced the consensus mark of $399 million and our estimate of $401.4 million. Adjusted EBITDA margin deteriorated 250 bps year over year to 53.2% due to reduced contribution from higher margin non-recurring revenues.
The Corporate and Other segment’s revenues amounted to $63 million, which plunged 32% year over year in the quarter under review. The reported figure surpassed the Zacks Consensus Estimate of $52 million and our estimate of $48 million. The business suffered due to divestitures of non-strategic businesses. Adjusted EBITDA loss was $92 million in the quarter under review, wider than the Zacks Consensus Estimate of a loss of $62 million.
Financial Update (As of Dec 31, 2023)
Fidelity National exited the fourth quarter with cash and cash equivalents of $440 million, which decreased 3.5% from the 2022-end level. Total assets of $55.1 billion fell 12.9% from the figure at 2022 end.
Long-term debt, excluding current portion, amounted to $13 billion, down 8.7% from the figure as of Dec 31, 2022. The current portion of long-term debt totaled $1.3 billion while short-term borrowings totaled $4.8 billion.
Total equity of $19.1 billion dropped 29.9% from the 2022-end figure.
FIS generated net cash from operations of $1.5 billion in the fourth quarter, which climbed 33.9% year over year. Free cash flows soared 63.9% year over year to $1.1 billion.
Share Repurchase & Dividend Update
Fidelity National rewarded $815 million to its shareholders to the tune of share buybacks worth $510 million and dividends of $305 million in the fourth quarter.
Capital Deployment Targets
Management aims to return a minimum of roughly $4 billion to its shareholders through share buybacks by the end of 2024, which includes $510 million repurchases conducted in the fourth quarter of 2023. FIS reiterates its aim to achieve a dividend payout ratio of 35% of adjusted net earnings, excluding equity method investment earnings (loss).
Business Update
The agreement to divest a majority stake in the Worldpay Merchant Solutions business to private equity funds managed by GTCR was completed on Jan 31, 2024, as per the targeted timeline.
From the first quarter of 2024, the 45% ownership that Fidelity National holds in the Worldpay Merchant Solutions business will be reported in the income statement under "Equity method investment earnings (loss)".
Update on Enterprise Transformation Program
FIS has achieved annualized run-rate Future Forward cash savings of more than $550 million as of Dec 31, 2023. The company reiterates its aim to achieve cash savings of $1 billion by 2024 end, out of which more than 75% belong to run-rate cash savings. It is also likely to benefit the company by bringing about a year-over-year increase of $280 million in adjusted EBITDA in 2024.
1Q24 View
Management forecasts revenues between $2.430 billion and $2.455 billion. Adjusted EBITDA is projected to be $955-$970 million. Adjusted EPS is estimated between 94 cents and 97 cents. Adjusted EBITDA margin is projected to be 39.3-39.5%.
Revenues from the Banking Solutions unit are anticipated to witness year-over-year increase of 1-2%, while it is estimated to grow in the range of 6-7% for the Capital Market Solutions business.
2024 Guidance Unveiled
Revenues are expected to lie within $10.10-$10.15 billion, the mid-point of which indicates an improvement of 3.1% from the 2023 figure of $9.8 billion.
The Banking Solutions and Capital Market Solutions units are estimated to record year-over-year increases of 3-3.5% and 6.5-7%, respectively.
Adjusted EBITDA is projected between $4.10 billion and $4.14 billion in 2024, the midpoint of which suggests 3.7% growth from the 2023 figure of $4 billion. Adjusted EBITDA margin is anticipated within 40.6-40.8%.
Adjusted EPS is forecasted to lie between $4.66 and $4.76, the mid-point of which implies a 39.8% surge from the 2023 figure of $3.37.
Net interest expenses are likely to stay within $345-$350 million for 2024.
Zacks Rank
Fidelity National currently carries a Zacks Rank #3 (Hold). You can see the complete list of today’s Zacks #1 Rank (Strong Buy) stocks here.
Other Business Services Sector Releases
Of the Business Services sector players that have already released fourth-quarter 2023 results so far, the bottom-line results of Mastercard Incorporated MA, Global Payments Inc. GPN and The Western Union Company WU beat the Zacks Consensus Estimate.
Mastercard reported fourth-quarter 2023 adjusted earnings of $3.18 per share, which outpaced the Zacks Consensus Estimate by 3.3%. The bottom line climbed 20% year over year. Net revenues of the leading technology company in the global payments industry amounted to $6.5 billion, which improved 13% year over year in the quarter under review. The top line beat the consensus mark by 1.4%. Gross dollar volume rose 10% on a local-currency basis to $2.4 trillion in the fourth quarter.
Cross-border volumes of MA advanced 18% on a local currency basis. Value-added services and solutions net revenues of $2.7 billion improved 19% year over year. MA’s clients issued 3.3 billion Mastercard and Maestro-branded cards as of Dec 31, 2023. Its operating income advanced 6% year over year to $3.4 billion. Operating margin of 51.5% improved 320 bps year over year in the quarter under review.
Global Payments reported fourth-quarter 2023 adjusted EPS of $2.65, which beat the Zacks Consensus Estimate of $2.63. The bottom line rose 10% year over year. Adjusted net revenues improved 8% year over year to $2.19 billion. The top line surpassed the consensus mark of $2.18 billion. Adjusted operating income of $978.5 million advanced 8.9% year over year in the quarter under review.
The adjusted operating margin improved 30 bps year over year to 44.8%. The Merchant Solutions segment recorded adjusted revenues of $1.7 billion in the fourth quarter, which rose 18.5% year over year. The unit’s adjusted operating income advanced 17% year over year to $797.3 million. Meanwhile, GPN’s Issuer Solutions segment reported adjusted revenues of $530.6 million, which grew 5.8% year over year.
Western Union reported fourth-quarter 2023 adjusted EPS of 37 cents, which beat the Zacks Consensus Estimate by 2.8%. The bottom line rose 15.6% year over year. Total revenues declined 3.7% year over year on a reported basis or grew 3% on a constant-currency basis to $1.05 billion. The top line beat the Zacks Consensus Estimate by 4.8%.
Adjusted operating margin of 16.1% improved 30 bps year over year. The CMT or Consumer Money Transfer segment reported revenues of $975.5 million, which declined 1% year over year on a reported and constant-currency basis in the quarter under review. Operating income improved 7% year over year to $148.9 million. The operating income margin of 15.3% rose from 14.1% a year ago. Transactions within the CMT segment increased 5.2% year over year. Branded Digital revenues increased 4% on a reported and constant-currency basis.
Want the latest recommendations from Zacks Investment Research? Today, you can download 7 Best Stocks for the Next 30 Days. Click to get this free report
Mastercard Incorporated (MA) : Free Stock Analysis Report
Fidelity National Information Services, Inc. (FIS) : Free Stock Analysis Report
The Western Union Company (WU) : Free Stock Analysis Report
Global Payments Inc. (GPN) : Free Stock Analysis Report
