Fidelity National (FNF) Q4 Earnings Miss on Lower Title Volumes
Fidelity National Financial, Inc. FNF reported fourth-quarter 2023 operating income per share of 75 cents, which missed the Zacks Consensus Estimate by 26.5%.
The bottom line decreased 29.2% on a year-over-year basis due to a significant decline in Title volume.
Behind the Headlines
Operating revenues increased 34.4% year over year to $3.4 billion in the quarter, driven by higher escrow, title-related and other fees as well as interest and investment income. The top line beat the Zacks Consensus Estimate by 22.6%.
Interest and investment income of $692 million increased 28.5% year over year.
Fidelity National Financial, Inc. Price, Consensus and EPS Surprise
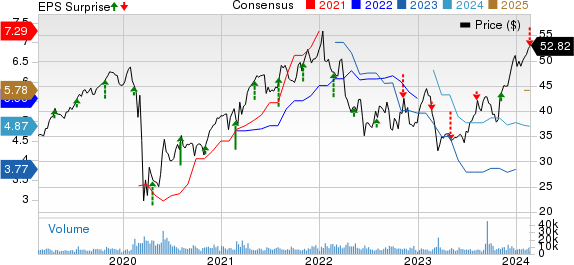
Fidelity National Financial, Inc. price-consensus-eps-surprise-chart | Fidelity National Financial, Inc. Quote
Total expenses increased 66.1% year over year to $3.6 billion due to higher personnel costs, agent commissions, other operating expenses, depreciation and amortization, claims loss expense and interest expenses.
Segment Results
Total revenues at Title fell 10.5% year over year to $1.7 billion. While direct title premiums declined 10% to $489 million in the quarter, agency title premiums decreased 13% year over year to $619 million. Commercial revenues of $294 million declined 15%.
Adjusted pre-tax title margin came in at 11.8%, which contracted 50 basis points (bps) year over year due to a fall in residential and commercial volumes.
Purchase orders opened increased 1% on a daily basis. Purchase orders closed decreased 7% on a daily basis.
Refinance orders opened fell 11% on a daily basis and refinance orders closed decreased 23%. Commercial orders opened declined 3% and commercial orders closed decreased 14%. The total fee per file of $3,806 in the fourth quarter increased 4% year over year.
Gross sales at F&G were $4.1 billion in the fourth quarter, up 52% year over year, driven by record retail channel sales and strong institutional market sales.
Retail channel sales of $3 billion increased 20%, driven by robust multiyear guaranteed annuity sales in the higher rate environment. Institutional market sales of $1.1 billion increased more than five-fold, driven by higher pension risk transfer and FHLB funding agreement sales.
Net sales of $2.5 billion increased 31.6%.
Average assets under management amounted to a record $49.5 billion at quarter-end, up 13.5% year over year, driven by net new business flows, stable inforce retention and net debt proceeds over the past 12 months. AUM before flow reinsurance was $56.3 billion as of Dec 31, 2023
Financial Update
Fidelity National exited 2023 with a cash and investment portfolio of $58.8 billion, up 23.2% from the 2022-end level. As of Dec 31, 2023, notes payable of $3.9 billion were up 20% from the figure at 2022 end.
Stockholders’ equity of $6.9 billion increased 12.9% from the figure as of Dec 31, 2022.
Zacks Rank
Fidelity National currently carries a Zacks Rank #4 (Sell).
You can see the complete list of today’s Zacks #1 Rank (Strong Buy) stocks here.
Performance of Other Property & Casualty Insurers
The Travelers Companies TRV reported fourth-quarter 2023 core income of $7.01 per share, which beat the Zacks Consensus Estimate of $5.04. The bottom line more than doubled year over year, driven by higher underlying underwriting gain, lower catastrophe losses and higher net investment income. Travelers’ total revenues increased 13.5% from the year-ago quarter to $10.9 billion, primarily driven by higher premiums. The top-line figure beat the Zacks Consensus Estimate by 0.2%.
Net written premiums increased 13% year over year to about $10 billion, driven by strong growth across all three segments. The figure was higher than our estimate of $9.7 billion. TRV witnessed an underwriting gain of $1.4 billion, up more than three-fold year over year, driven by higher business volumes. The combined ratio improved 870 bps year over year to 85.8, driven by a lower underlying combined ratio and catastrophe losses.
The Progressive Corporation’s PGR fourth-quarter 2023 earnings per share of $2.96 beat the Zacks Consensus Estimate of $2.38. The bottom line improved 97.3% year over year. Operating revenues of $16.6 billion beat the Zacks Consensus Estimate by 3% and increased 23.2% year over year.
Net premiums written were $15.1 billion in the quarter, up 21% from $12.5 billion a year ago. PGR’s premiums beat our estimate of $14 billion. Net premiums earned grew 22% to $15.8 billion and beat our estimate of $14.8 billion.
Progressive’s combined ratio improved 520 bps from the prior-year quarter’s level to 88.7.
W.R. Berkley Corporation’s WRB fourth-quarter 2023 operating income of $1.45 per share beat the Zacks Consensus Estimate of $1.35 by 7.4%. The bottom line improved 25% year over year. Operating revenues came in at $3.2 billion, up 9.3% year over year, on the back of higher net premiums earned as well as improved net investment income. The top line beat the consensus estimate by 1.3%
W.R. Berkley’s net premiums written were $2.7 billion, up 12% year over year. The figure was lower than our estimate of $2.8 billion. Pre-tax underwriting income increased 8.2% to $315.9 million. The consolidated combined ratio remained flat year over year at 88.4.
Want the latest recommendations from Zacks Investment Research? Today, you can download 7 Best Stocks for the Next 30 Days. Click to get this free report
The Travelers Companies, Inc. (TRV) : Free Stock Analysis Report
W.R. Berkley Corporation (WRB) : Free Stock Analysis Report
The Progressive Corporation (PGR) : Free Stock Analysis Report
Fidelity National Financial, Inc. (FNF) : Free Stock Analysis Report
