Fintel Plc's (LON:FNTL) Stock Has Been Sliding But Fundamentals Look Strong: Is The Market Wrong?
Fintel (LON:FNTL) has had a rough three months with its share price down 4.2%. However, stock prices are usually driven by a company’s financial performance over the long term, which in this case looks quite promising. Particularly, we will be paying attention to Fintel's ROE today.
Return on equity or ROE is a key measure used to assess how efficiently a company's management is utilizing the company's capital. Simply put, it is used to assess the profitability of a company in relation to its equity capital.
See our latest analysis for Fintel
How Do You Calculate Return On Equity?
The formula for return on equity is:
Return on Equity = Net Profit (from continuing operations) ÷ Shareholders' Equity
So, based on the above formula, the ROE for Fintel is:
10% = UK£10m ÷ UK£98m (Based on the trailing twelve months to December 2022).
The 'return' is the income the business earned over the last year. So, this means that for every £1 of its shareholder's investments, the company generates a profit of £0.10.
What Is The Relationship Between ROE And Earnings Growth?
Thus far, we have learned that ROE measures how efficiently a company is generating its profits. We now need to evaluate how much profit the company reinvests or "retains" for future growth which then gives us an idea about the growth potential of the company. Assuming everything else remains unchanged, the higher the ROE and profit retention, the higher the growth rate of a company compared to companies that don't necessarily bear these characteristics.
A Side By Side comparison of Fintel's Earnings Growth And 10% ROE
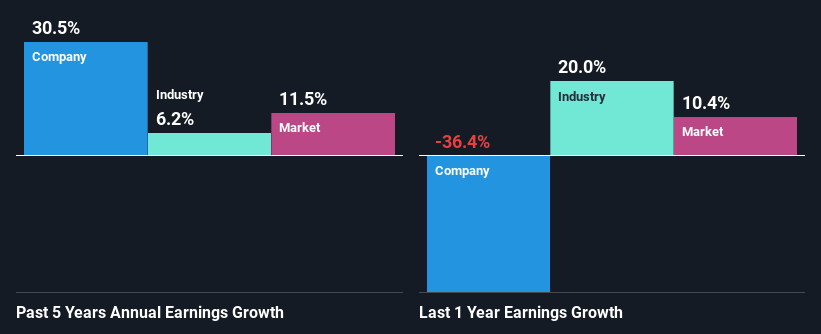
To start with, Fintel's ROE looks acceptable. Be that as it may, the company's ROE is still quite lower than the industry average of 20%. Still, we can see that Fintel has seen a remarkable net income growth of 30% over the past five years. Therefore, there could be other causes behind this growth. For instance, the company has a low payout ratio or is being managed efficiently. However, not to forget, the company does have a decent ROE to begin with, just that it is lower than the industry average. So this also does lend some color to the high earnings growth seen by the company.
Next, on comparing with the industry net income growth, we found that Fintel's growth is quite high when compared to the industry average growth of 6.2% in the same period, which is great to see.
The basis for attaching value to a company is, to a great extent, tied to its earnings growth. It’s important for an investor to know whether the market has priced in the company's expected earnings growth (or decline). This then helps them determine if the stock is placed for a bright or bleak future. What is FNTL worth today? The intrinsic value infographic in our free research report helps visualize whether FNTL is currently mispriced by the market.
Is Fintel Making Efficient Use Of Its Profits?
The three-year median payout ratio for Fintel is 34%, which is moderately low. The company is retaining the remaining 66%. This suggests that its dividend is well covered, and given the high growth we discussed above, it looks like Fintel is reinvesting its earnings efficiently.
Moreover, Fintel is determined to keep sharing its profits with shareholders which we infer from its long history of five years of paying a dividend. Existing analyst estimates suggest that the company's future payout ratio is expected to drop to 27% over the next three years. Regardless, the ROE is not expected to change much for the company despite the lower expected payout ratio.
Conclusion
Overall, we are quite pleased with Fintel's performance. Particularly, we like that the company is reinvesting heavily into its business at a moderate rate of return. Unsurprisingly, this has led to an impressive earnings growth. Having said that, the company's earnings growth is expected to slow down, as forecasted in the current analyst estimates. To know more about the latest analysts predictions for the company, check out this visualization of analyst forecasts for the company.
Have feedback on this article? Concerned about the content? Get in touch with us directly. Alternatively, email editorial-team (at) simplywallst.com.
This article by Simply Wall St is general in nature. We provide commentary based on historical data and analyst forecasts only using an unbiased methodology and our articles are not intended to be financial advice. It does not constitute a recommendation to buy or sell any stock, and does not take account of your objectives, or your financial situation. We aim to bring you long-term focused analysis driven by fundamental data. Note that our analysis may not factor in the latest price-sensitive company announcements or qualitative material. Simply Wall St has no position in any stocks mentioned.
Join A Paid User Research Session
You’ll receive a US$30 Amazon Gift card for 1 hour of your time while helping us build better investing tools for the individual investors like yourself. Sign up here
