First Community Bankshares' (NASDAQ:FCBC) three-year earnings growth trails the 23% YoY shareholder returns
By buying an index fund, you can roughly match the market return with ease. But if you choose individual stocks with prowess, you can make superior returns. Just take a look at First Community Bankshares, Inc. (NASDAQ:FCBC), which is up 66%, over three years, soundly beating the market return of 15% (not including dividends). On the other hand, the returns haven't been quite so good recently, with shareholders up just 16% , including dividends .
On the back of a solid 7-day performance, let's check what role the company's fundamentals have played in driving long term shareholder returns.
See our latest analysis for First Community Bankshares
In his essay The Superinvestors of Graham-and-Doddsville Warren Buffett described how share prices do not always rationally reflect the value of a business. One flawed but reasonable way to assess how sentiment around a company has changed is to compare the earnings per share (EPS) with the share price.
First Community Bankshares was able to grow its EPS at 10% per year over three years, sending the share price higher. In comparison, the 19% per year gain in the share price outpaces the EPS growth. This suggests that, as the business progressed over the last few years, it gained the confidence of market participants. That's not necessarily surprising considering the three-year track record of earnings growth.
The company's earnings per share (over time) is depicted in the image below (click to see the exact numbers).
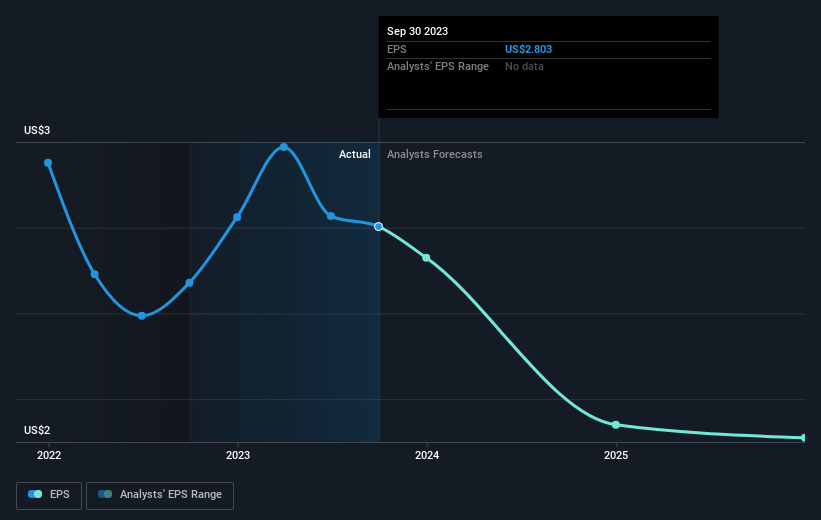
It's probably worth noting that the CEO is paid less than the median at similar sized companies. But while CEO remuneration is always worth checking, the really important question is whether the company can grow earnings going forward. Dive deeper into the earnings by checking this interactive graph of First Community Bankshares' earnings, revenue and cash flow.
What About Dividends?
When looking at investment returns, it is important to consider the difference between total shareholder return (TSR) and share price return. The TSR is a return calculation that accounts for the value of cash dividends (assuming that any dividend received was reinvested) and the calculated value of any discounted capital raisings and spin-offs. Arguably, the TSR gives a more comprehensive picture of the return generated by a stock. We note that for First Community Bankshares the TSR over the last 3 years was 86%, which is better than the share price return mentioned above. This is largely a result of its dividend payments!
A Different Perspective
First Community Bankshares provided a TSR of 16% over the last twelve months. But that return falls short of the market. On the bright side, that's still a gain, and it's actually better than the average return of 8% over half a decade This suggests the company might be improving over time. I find it very interesting to look at share price over the long term as a proxy for business performance. But to truly gain insight, we need to consider other information, too. For instance, we've identified 2 warning signs for First Community Bankshares (1 can't be ignored) that you should be aware of.
If you are like me, then you will not want to miss this free list of growing companies that insiders are buying.
Please note, the market returns quoted in this article reflect the market weighted average returns of stocks that currently trade on American exchanges.
Have feedback on this article? Concerned about the content? Get in touch with us directly. Alternatively, email editorial-team (at) simplywallst.com.
This article by Simply Wall St is general in nature. We provide commentary based on historical data and analyst forecasts only using an unbiased methodology and our articles are not intended to be financial advice. It does not constitute a recommendation to buy or sell any stock, and does not take account of your objectives, or your financial situation. We aim to bring you long-term focused analysis driven by fundamental data. Note that our analysis may not factor in the latest price-sensitive company announcements or qualitative material. Simply Wall St has no position in any stocks mentioned.
