Do You Like First Financial Corporation (NASDAQ:THFF) At This P/E Ratio?

This article is written for those who want to get better at using price to earnings ratios (P/E ratios). We'll show how you can use First Financial Corporation's (NASDAQ:THFF) P/E ratio to inform your assessment of the investment opportunity. What is First Financial's P/E ratio? Well, based on the last twelve months it is 8.64. That means that at current prices, buyers pay $8.64 for every $1 in trailing yearly profits.
Check out our latest analysis for First Financial
How Do You Calculate A P/E Ratio?
The formula for P/E is:
Price to Earnings Ratio = Price per Share ÷ Earnings per Share (EPS)
Or for First Financial:
P/E of 8.64 = $32.830 ÷ $3.799 (Based on the year to December 2019.)
(Note: the above calculation results may not be precise due to rounding.)
Is A High Price-to-Earnings Ratio Good?
A higher P/E ratio means that investors are paying a higher price for each $1 of company earnings. All else being equal, it's better to pay a low price -- but as Warren Buffett said, 'It's far better to buy a wonderful company at a fair price than a fair company at a wonderful price'.
Does First Financial Have A Relatively High Or Low P/E For Its Industry?
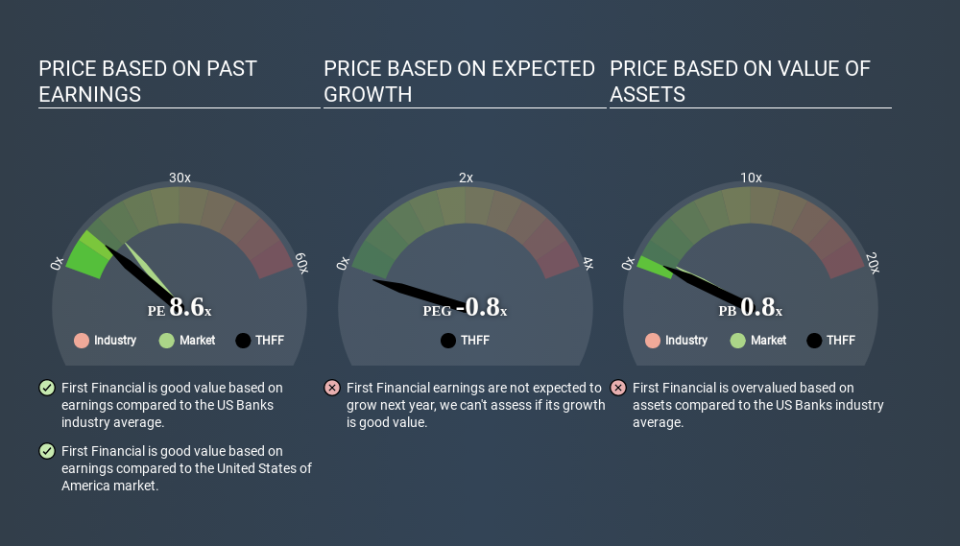
We can get an indication of market expectations by looking at the P/E ratio. The image below shows that First Financial has a P/E ratio that is roughly in line with the banks industry average (8.8).
First Financial's P/E tells us that market participants think its prospects are roughly in line with its industry. If the company has better than average prospects, then the market might be underestimating it. Further research into factors such as insider buying and selling, could help you form your own view on whether that is likely.
How Growth Rates Impact P/E Ratios
Probably the most important factor in determining what P/E a company trades on is the earnings growth. That's because companies that grow earnings per share quickly will rapidly increase the 'E' in the equation. And in that case, the P/E ratio itself will drop rather quickly. So while a stock may look expensive based on past earnings, it could be cheap based on future earnings.
First Financial's earnings per share were pretty steady over the last year. But over the longer term (5 years) earnings per share have increased by 8.3%.
A Limitation: P/E Ratios Ignore Debt and Cash In The Bank
Don't forget that the P/E ratio considers market capitalization. Thus, the metric does not reflect cash or debt held by the company. Hypothetically, a company could reduce its future P/E ratio by spending its cash (or taking on debt) to achieve higher earnings.
Such spending might be good or bad, overall, but the key point here is that you need to look at debt to understand the P/E ratio in context.
So What Does First Financial's Balance Sheet Tell Us?
The extra options and safety that comes with First Financial's US$6.9m net cash position means that it deserves a higher P/E than it would if it had a lot of net debt.
The Bottom Line On First Financial's P/E Ratio
First Financial trades on a P/E ratio of 8.6, which is below the US market average of 13.3. The recent drop in earnings per share would make investors cautious, but the net cash position means the company has time to improve: if so, the low P/E could be an opportunity.
When the market is wrong about a stock, it gives savvy investors an opportunity. If it is underestimating a company, investors can make money by buying and holding the shares until the market corrects itself. So this free visualization of the analyst consensus on future earnings could help you make the right decision about whether to buy, sell, or hold.
You might be able to find a better buy than First Financial. If you want a selection of possible winners, check out this free list of interesting companies that trade on a P/E below 20 (but have proven they can grow earnings).
If you spot an error that warrants correction, please contact the editor at editorial-team@simplywallst.com. This article by Simply Wall St is general in nature. It does not constitute a recommendation to buy or sell any stock, and does not take account of your objectives, or your financial situation. Simply Wall St has no position in the stocks mentioned.
We aim to bring you long-term focused research analysis driven by fundamental data. Note that our analysis may not factor in the latest price-sensitive company announcements or qualitative material. Thank you for reading.
