First Horizon's (FHN) Q2 Earnings Top Estimates, Revenues Rise
First Horizon National Corporation’s FHN second-quarter 2023 adjusted earnings per share (excluding notable items) of 39 cents surpassed the Zacks Consensus Estimate. The figure also improved 14.7% year over year.
Results benefited from higher net interest income (NII) and non-interest income. Also, improving loan and deposit balances were tailwinds. However, higher provisions and rising expenses were undermining factors.
Net income available to common shareholders was $317 million, up 91% year over year.
Revenues & Expenses Rise, Growth in Loans & Deposits
Total revenues were $1.03 billion, up 38.8% year over year. Also, the top line surpassed the Zacks Consensus Estimate of $820.2 million.
NII increased 16.4% year over year to $631 million. Also, the net interest margin expanded 64 basis points to 3.38%.
Non-interest income was $400 million, surging 99% from the year-ago level.
Non-interest expenses rose 13.5% year over year to $555 million.
The efficiency ratio was 53.87%, down from the year-ago period’s 65.76%. A fall in the efficiency ratio indicates an increase in profitability.
Total period-end loans and leases, and net of unearned income were $61.3 billion, up 3.8% from the prior quarter’s end. Total period-end deposits of $65.43 billion grew 6.5%.
Credit Quality Worsens
Non-performing loans and leases of $402 million increased 33.5% from the prior-year period's levels. The reported quarter witnessed net charge-offs of $23 million, which rose from the year-ago quarter’s $12 million. Moreover, provisions for credit losses were $50 million compared with $30 million in the year-earlier quarter.
The allowance for loan and lease losses of $737 million increased 18.1% from the year-ago period. As of Jun 30, 2023, the ratio of total allowance for loan and lease losses to loans and leases was 1.20%, up from 1.10% in the prior-year quarter.
Capital Ratios Improve
As of Jun 30, 2023, the Common Equity Tier 1 ratio was 11.1%, up from 9.8% at the end of the year-ago quarter.
The total capital ratio was 13.6%, up from the previous-year quarter’s 13%. Tier 1 leverage ratio was 10.5%, up from 9.1% in the prior year.
Our Viewpoint
First Horizon has expanded its footprint in the targeted markets. Going forward, FHN is likely to benefit from growth in its loan and deposit balances. However, elevated expenses are likely to limit bottom-line growth in the upcoming period.
First Horizon Corporation Price, Consensus and EPS Surprise
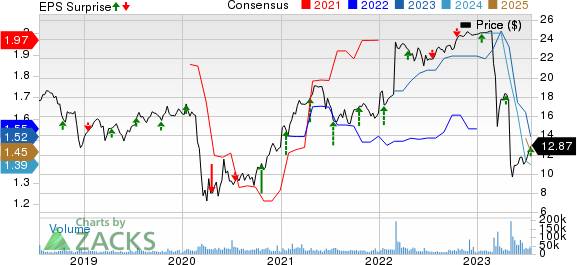
First Horizon Corporation price-consensus-eps-surprise-chart | First Horizon Corporation Quote
First Horizon currently carries a Zacks Rank #5 (Strong Sell).
You can see the complete list of today's Zacks #1 Rank (Strong Buy) stocks here.
Performance of Major Banks
Citigroup’s C second-quarter 2023 earnings per share (excluding divestiture-related impacts) of $1.37 outpaced the Zacks Consensus Estimate of $1.31.
C witnessed a decline in the top line due to lower revenues in the Institutional Clients Group. Also, the higher cost of credit was a spoilsport. Nonetheless, higher revenues in the Personal Banking and Wealth Management segments were bright spots.
Support from First Republic Bank acquisition, consumer banking business, higher rates and solid loan balance drove JPMorgan’s JPM second-quarter 2023 adjusted earnings of $4.37 per share. The bottom line handily surpassed the Zacks Consensus Estimate of $3.62.
The results excluded significant items related to FRC acquisition on May 1 and net investment securities losses. After considering these, JPM’s earnings were $4.75 per share.
Want the latest recommendations from Zacks Investment Research? Today, you can download 7 Best Stocks for the Next 30 Days. Click to get this free report
JPMorgan Chase & Co. (JPM) : Free Stock Analysis Report
Citigroup Inc. (C) : Free Stock Analysis Report
First Horizon Corporation (FHN) : Free Stock Analysis Report
