The Fission Uranium (TSE:FCU) Share Price Is Down 67% So Some Shareholders Are Wishing They Sold

Statistically speaking, long term investing is a profitable endeavour. But unfortunately, some companies simply don't succeed. Zooming in on an example, the Fission Uranium Corp. (TSE:FCU) share price dropped 67% in the last half decade. That's an unpleasant experience for long term holders. And we doubt long term believers are the only worried holders, since the stock price has declined 30% over the last twelve months. The falls have accelerated recently, with the share price down 15% in the last three months.
Check out our latest analysis for Fission Uranium
Fission Uranium didn't have any revenue in the last year, so it's fair to say it doesn't yet have a proven product (or at least not one people are paying for). You have to wonder why venture capitalists aren't funding it. So it seems that the investors focused more on what could be, than paying attention to the current revenues (or lack thereof). It seems likely some shareholders believe that Fission Uranium will discover or develop fossil fuel before too long.
Companies that lack both meaningful revenue and profits are usually considered high risk. There is almost always a chance they will need to raise more capital, and their progress - and share price - will dictate how dilutive that is to current holders. While some such companies do very well over the long term, others become hyped up by promoters before eventually falling back down to earth, and going bankrupt (or being recapitalized). Some Fission Uranium investors have already had a taste of the bitterness stocks like this can leave in the mouth.
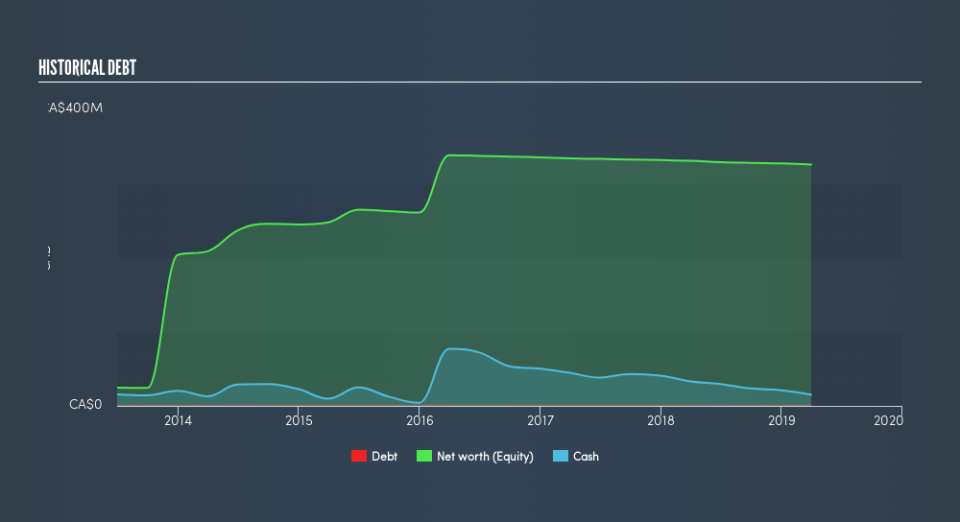
When it reported in March 2019 Fission Uranium had minimal cash in excess of all liabilities consider its expenditure: just CA$11m to be specific. So if it hasn't remedied the situation already, it will almost certainly have to raise more capital soon. With that in mind, you can understand why the share price dropped 20% per year, over 5 years. You can click on the image below to see (in greater detail) how Fission Uranium's cash levels have changed over time. The image below shows how Fission Uranium's balance sheet has changed over time; if you want to see the precise values, simply click on the image.
In reality it's hard to have much certainty when valuing a business that has neither revenue or profit. What if insiders are ditching the stock hand over fist? I would feel more nervous about the company if that were so. It costs nothing but a moment of your time to see if we are picking up on any insider selling.
A Different Perspective
While the broader market gained around 1.4% in the last year, Fission Uranium shareholders lost 30%. Even the share prices of good stocks drop sometimes, but we want to see improvements in the fundamental metrics of a business, before getting too interested. Unfortunately, last year's performance may indicate unresolved challenges, given that it was worse than the annualised loss of 20% over the last half decade. Generally speaking long term share price weakness can be a bad sign, though contrarian investors might want to research the stock in hope of a turnaround. You could get a better understanding of Fission Uranium's growth by checking out this more detailed historical graph of earnings, revenue and cash flow.
But note: Fission Uranium may not be the best stock to buy. So take a peek at this free list of interesting companies with past earnings growth (and further growth forecast).
Please note, the market returns quoted in this article reflect the market weighted average returns of stocks that currently trade on CA exchanges.
We aim to bring you long-term focused research analysis driven by fundamental data. Note that our analysis may not factor in the latest price-sensitive company announcements or qualitative material.
If you spot an error that warrants correction, please contact the editor at editorial-team@simplywallst.com. This article by Simply Wall St is general in nature. It does not constitute a recommendation to buy or sell any stock, and does not take account of your objectives, or your financial situation. Simply Wall St has no position in the stocks mentioned. Thank you for reading.
